Figures & data
Figure 1. Areas of interest within the Romeo Malette Forest in Ontario, Canada. PlanetScope true color imagery shows both areas before and after harvesting.
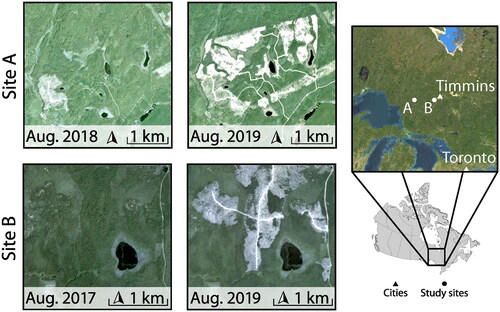
Table 1. Characteristics of imagery used from PlanetScope and Landsat Operational Land Imager (OLI) sensors.
Figure 2. Workflow for deriving a harvest map from PlanetScope images – pre-processing, temporal smoothing and interpolation, breakpoint analysis, and spatial filtering.
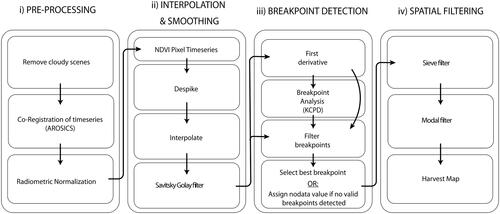
Figure 3. PlanetScope image availability over the study area for the target year (2018) in Site A. Red bars indicate images with > 10% clouds as determined by the PlanetScope algorithm, while yellow bars indicate images containing < 10% clouds but visually determined to have cloud cover unsuitable for analysis. Green and grey bars indicate days with usable images and no images, respectively.
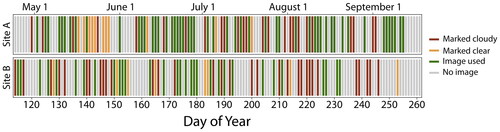
Figure 4. Error analysis for different penalty values and minimum NDVI thresholds in Site A.
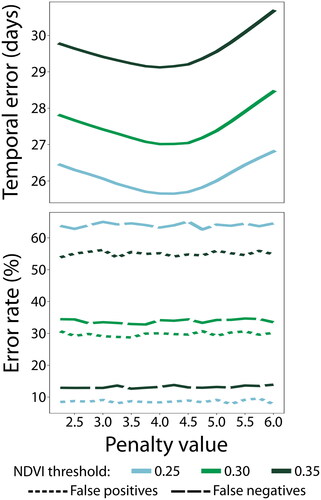
Figure 5. An example of the NDVI values in a single pixel in Site A throughout the growing season. Solid black lines represent significant breakpoints, with the red line as that with the highest probability of being a harvest. Using this method, the predicted harvest date was 8 days earlier than reported by the OpTracker data. The green and yellow lines represent the mean slopes of periods of positive and negative mean slopes, respectively, between breakpoints (vertical lines).
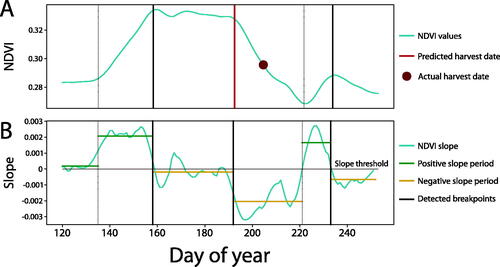
Table 2. The accuracy of the PlanetScope-based harvest date estimates, reported both temporally and spatially.
Figure 6. A comparison between the harvest day as observed by the OpTracker data (left) and predicted by PlanetScope (center). The difference (temporal error) is also shown for both sites in the right column.
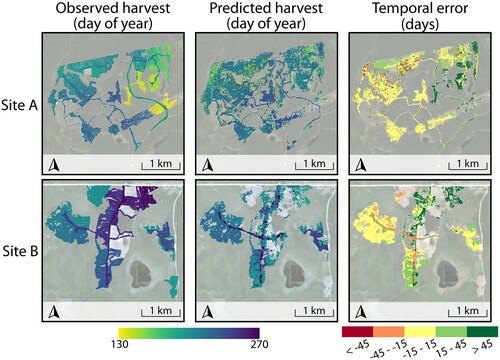
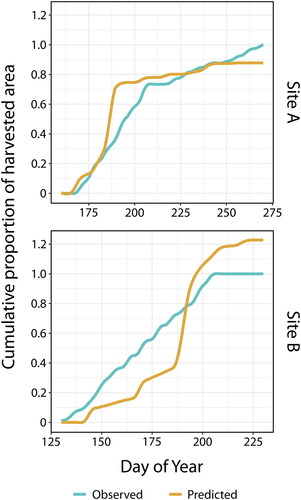
Figure 7. The cumulative proportion of area harvested in both sites, with the blue lines showing the progression of harvest reported by the OpTracker data, and the tan lines showing that of the predictions. The values are a proportion of the total harvested area as reported by the OpTracker data.