
Figures & data
Figure 1. Location of the watersheds of Hulu River and Lanni River.
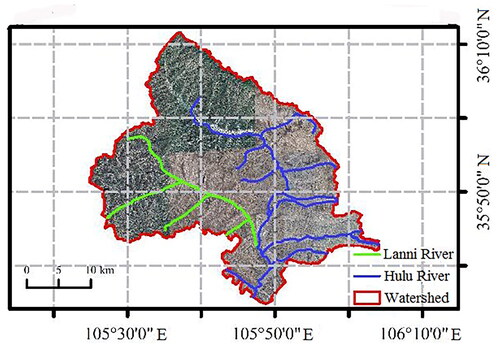
Figure 2. Examples of image slices.
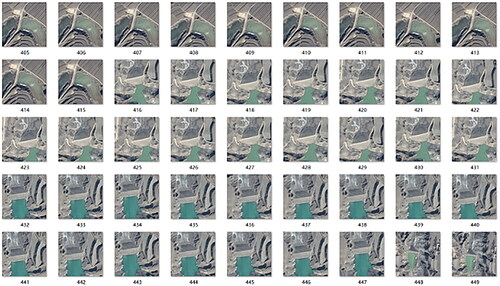
Figure 3. Structure of U-Net (source: https://www.jianshu.com/p/0bb14fb7de62).
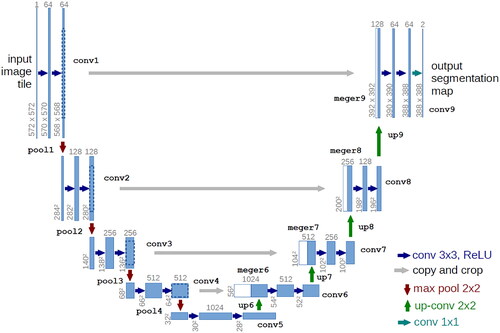
Figure 4. Visualized silt storage dams of original images (a), segmented by U-Net with different input sizes of 288 × 288 (b), 384 × 384 (c), 480 × 480 (d), and 576 × 576 (e), and ground truth of silt storage dams (f).
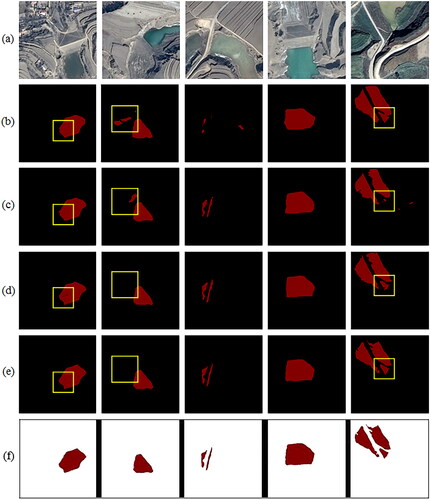
Table 1. Accuracies of silt storage dams semantically segmented by U-Net with different input sizes.
Figure 5. Visualized silt storage dams of original images (a) and segmented by U-Net with batch sizes of 2 (b), 3 (c), and 4 (d).
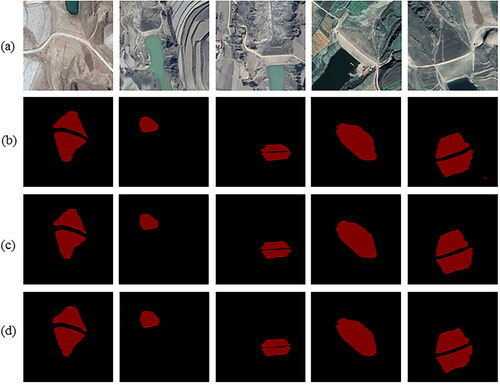
Table 2. Accuracies of silt storage dams segmented by U-Net with different batch sizes.
Figure 6. Visualized silt storage dams of original images (a and c) and segmented by U-Net model using Datasets 1 (b), 2 (d), and 3 (e).
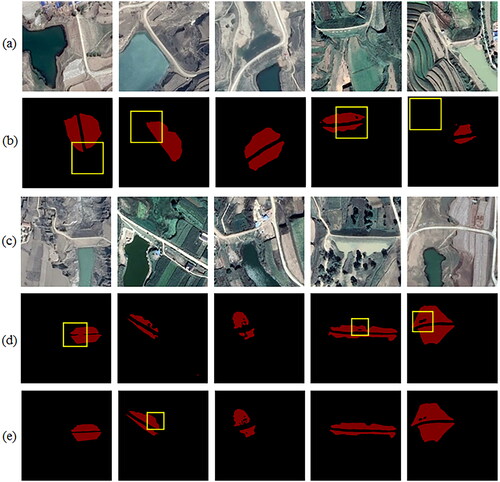
Table 3. Accuracies of silt storage dams segmented by U-Net with different sample sizes.
Figure 7. Loss curves obtained by U-Net based on Datasets 1 (a), 2 (b), and 3 (c).
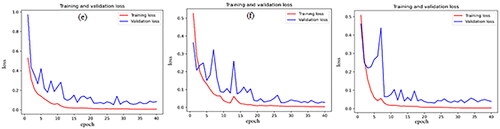
Table 4. Averages and standard deviations (SD) of accuracies of silt storage dams segmented by U-Net and FCN with input size of 576 × 576, batch size of 4, and Dataset 3 for 30 repeated trials.
Table 5. Comparison of F1, P, and MIoU obtained from the labeling functions and the label model with the images of input size of 576 × 576 and batch size of 4.