Figures & data
Figure 1. (A) Map of the study area found in the western Canadian Arctic in the southern Beaufort Sea near the hamlet of Tuktoyaktuk, NT. (B) Relative location of the two study sites. (C) Peninsula Point study site. Shown is the extent of a UAV survey in true-colourmosaic from 2018 (D1). The Peninsula Point study site is a polycyclic retrogressive thaw slump coastal environment with actively flowing thaw slumps and exposed massive ice in the headwall. (D) Tuktoyaktuk Island study side. Shown is the extent of a UAV survey in true-colourmosaic from 2018 (D1). Tuktoyaktuk Island is a coastal cliff environment with limited exposed massive ice and a small inactive thaw slump near the center of the survey area. Boundary polygons from the Atlas of Canada, National Scale Data 1:1,000,000 retrieved from Natural Resources Canada through the Open Government License. Base map data on inset map B retrieved from Planet Labs Inc. Map created using ArcMap 10.6. Permission is not required for use of this map.
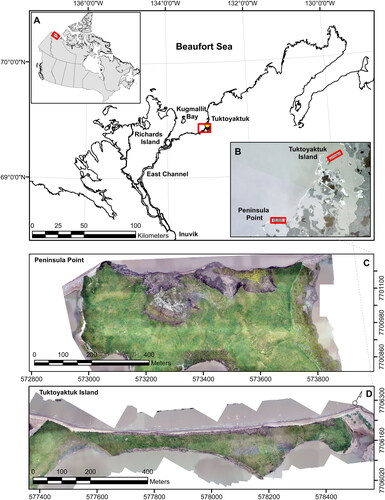
Table 1. UAV-SfM data collection and processing specifications.
Table 2. Mean absolute error (MAE) (m) and standard deviation (SD) (m) for all data sets at the Peninsula Point and Tuktoyaktuk Island study sites reported for each direction.
Figure 2. Coastal measurement schematic shown in planimetric and profile view. Three coastal features (waterline, cliff toe, and cliff edge) are used to measure net shoreline movements (NSM) between temporally spaced datasets. Coastal features from both time intervals are used to create cliff and beach envelopes used in volume change calculations. The volume change found within the transition zone, the overlap in cliff and beach envelopes, are subtracted from the total volume change to account for double counting of this area. NSM are calculated along 2 m spaced transects, oriented roughly perpendicular to coastline orientation. Change envelopes are bounded laterally by adjacent transects.
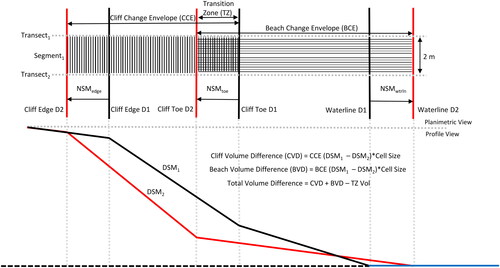
Figure 3. GEOBIA rule sets developed using eCognition Developer 9.5 software for the Peninsula Point and Tuktoyaktuk Island study sites. Rule sets utilized multiresolution segmentation, assign class, and merge to create geo-objects. Geo-objects were export as shapefiles and processed in ArcMap 10.6 to create individual line features.
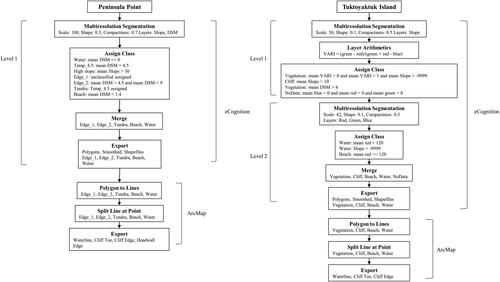
Table 3. Average planimetric and volumetric changes calculated between each time step at both study sites.
Figure 4. Net shoreline movement (NSM) for each coastal feature along the Tuktoyaktuk Island coastal site by time interval moving from west to east. Included are frequency occurrence graphs showing which class ranges are most common depending on the feature and time interval. Note the class range difference of the waterline feature to the cliff toe and edge class ranges. Negative values indicate landward movement (erosion) and positive value indicate seaward movement (accretion). NSM is feature and temporarily dependent.
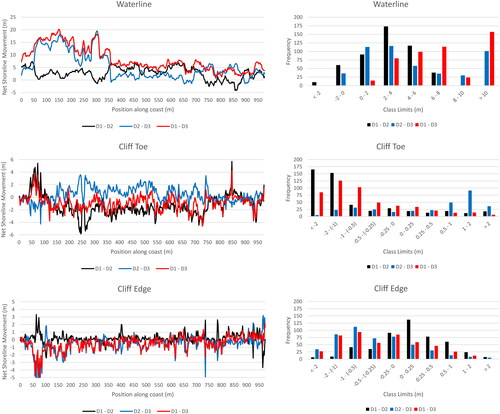
Figure 5. Direct comparison of net shoreline movement to volumetric measurements along the Tuktoyaktuk Island coastal site, moving west to east, by time interval. NSM are calculated along shore perpendicular transects and volume change is calculated from a DEM of difference (DoD) based on cliff and beach change envelopes. Planimetric erosion is denoted by negative values while volume loss is denoted by positive values. Over short time scales, the change in planimetric movement of coastal features differs while over longer time scales, coastal features tend to converge. Similarly, volumetric change between the cliff and beach becomes more uniform over longer time scales.
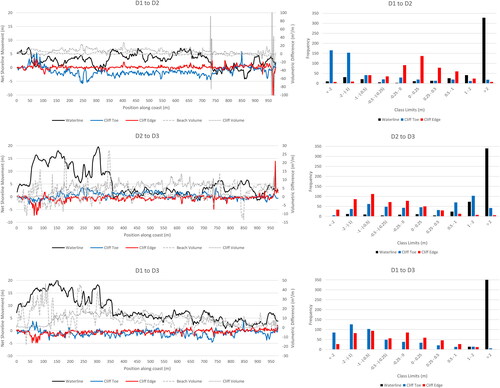
Figure 6. Net shoreline movement (NSM) for each coastal feature along the Peninsula Point coastal site by time interval moving from west to east. Included are frequency occurrence graphs showing which class ranges are most common depending on the feature and time interval. Note the class range difference of the waterline feature to the cliff toe and edge class ranges. Negative values indicate landward movement (erosion) and positive value indicate seaward movement (accretion). NSM is feature and temporarily dependent. The waterline position varied between landward and seaward movements, the cliff toe primarily moved landward but moved seaward in some cases depending on time interval, while the cliff edge moved landward in almost all cases.
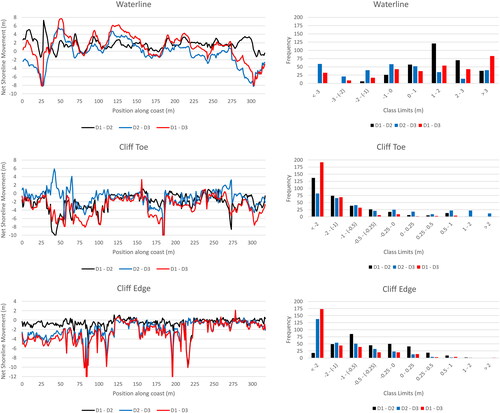
Figure 7. Direct comparison of net shoreline movement to volumetric measurements along the Peninsula Point coastal site, moving west to east, by time interval. NSM are calculated along shore perpendicular transects and volume change is calculated from a DEM of difference (DoD) based on cliff and beach change envelopes. Planimetric erosion is denoted by negative values while volume loss is denoted by positive values. The cliff toe (slump lobe) and cliff edge (headwall) were spatially distant, but both tended to move landward at a similar magnitude and during each time interval. Volume change tended to be dominated by cliff volume change in part due to the larger change envelope and relatively small beach area at this site.
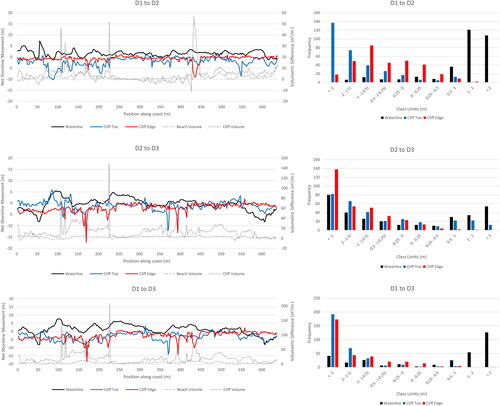
Figure 8. Study sites Tuktoyaktuk Island (A) and Peninsula Point (D) shown in true colour orthomosaic. Classification results derived from GEOBIA rulesets at Tuktoyaktuk Island (B) and Peninsula Point (E) showing enlarged spatial extents represented in panels C and F. Classified images shown in panels B and E used to derived coastal features at Tuktoyaktuk Island (C) and Peninsula Point (F) based on the boundary lines between classes. Extracted line features follow the classification boundaries more closely at Tuktoyaktuk Island than Peninsula Point where the coastal environment is more complex. Note that the irregular illumination in A and D caused by variable lighting during data collection was mitigated by utilizing an object-based approach that leverages homogeneous region building.
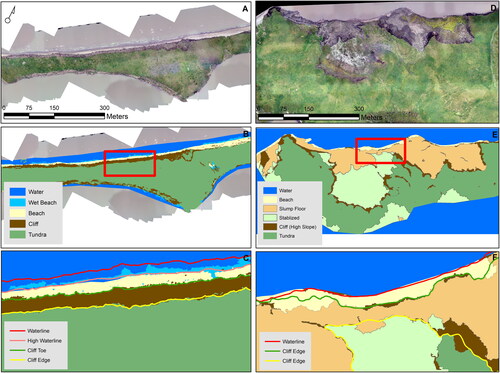
Figure 9. GEOBIA feature extraction accuracy for each coastal feature according to time interval along the Tuktoyaktuk Island coastal site. Each line represents the difference between the GEOBIA extracted coastal feature and the manually identified feature for a given dataset. Positive values indicate the GEOBIA feature was seaward of the manually identified feature. Note the different scales between features indicating the waterline was extracted with reduced accuracy. Frequency occurrence graphs help identify accuracy in GEOBIA feature detection relative to a set of class ranges. Note the difference in frequency scale and class ranges of the waterline feature.
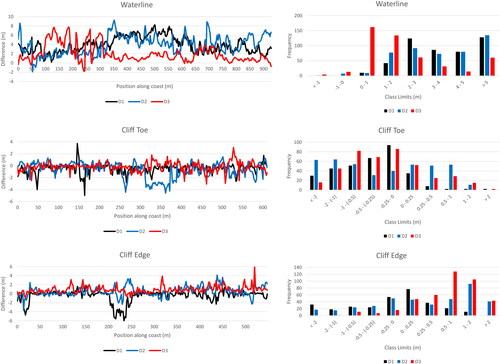
Figure 10. GEOBIA feature extraction accuracy for each coastal feature according to time interval along the Peninsula Point coastal site. Each line represents the difference between the GEOBIA extracted coastal feature and the manually identified feature for a given dataset. Positive values indicate the GEOBIA feature was seaward of the manually identified feature. Note the different scales between features indicating the waterline was extracted with reduced accuracy. Frequency occurrence graphs help identify accuracy in GEOBIA feature detection relative to a set of class ranges. Note the difference in frequency scale and class ranges of the waterline feature.
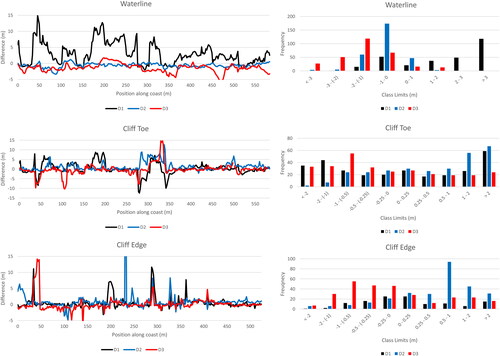
Table 4. GEOBIA extracted coastal features compared to manually digitized features.
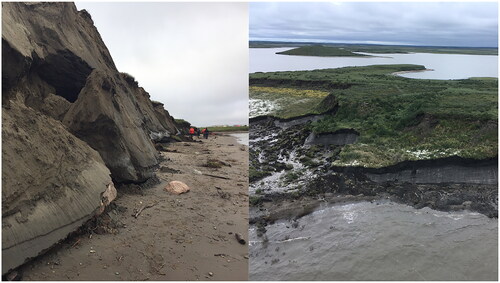
Figure 11. Shore level images of Tuktoyaktuk Island (left) and Peninsula Point (right). Note the steep slope of the Tuktoyaktuk Island coastal site, which shows undercutting caused by a storm surge leading to block failure. The cliff face has a sandy texture with areas of massive ice. By contrast, the Peninsula Point image shows the character of massive ice found in the headwall leading to retrogressive thaw flows, which are removed from the beach face through wave action. Also visible are the remnants (headwalls) of previously active retrogressive thaw slumps which have stabilized with the development of vegetation.