Figures & data
Figure 1. Coronation Gulf marine region (red polygon), Nunavut, Canada. The image is a RSAT-2 dual-polarized (RGB: HH-HH-HV) ScanSAR Wide image acquired 2010-04-26 00:42:04 UTC.
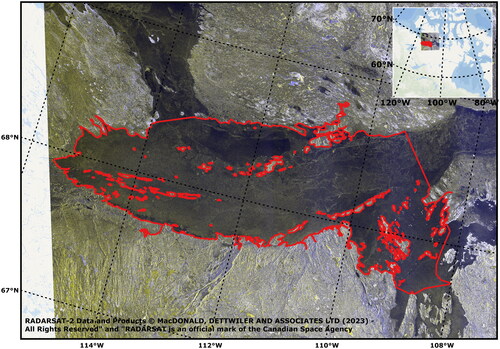
Figure 2. Example of a CIS weekly ice chart of Canadian Western Arctic. Full ice coverage (10 tenths) is shown in (a) (October 18, 2010) and ice free (0 tenths) is shown in (b) (August 16, 2010). Red rectangles highlight the Coronation Gulf marine region.
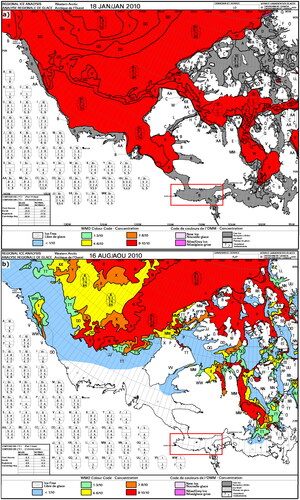
Table 1. Sampling periods for full ice coverage (10/10 landfast ice) and ice-free conditions.
Table 2. Number of RSAT-2 SCWA scenes available per class per year.
Table 3. Architecture of the convolutional neural network used.
Figure 3. Backscatter intensity (σ0) distribution per degree of incidence angle for the HH channel. Orange line is the median, boxes correspond to the 1st and 3rd quartile and whiskers represent the 5th and 95th percentile. Red line corresponds to the ScanSAR noise floor (NESZ).
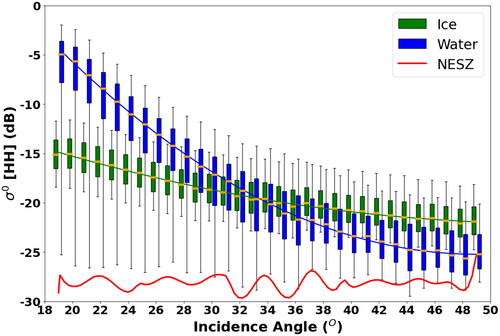
Figure 4. Backscatter intensity (σ0) distribution per degree of incidence angle for the HV channel. Orange line is the median, boxes correspond to the 1st and 3rd quartile and whiskers represent the 5th and 95th percentile. Red line corresponds to the ScanSAR noise floor (NESZ).
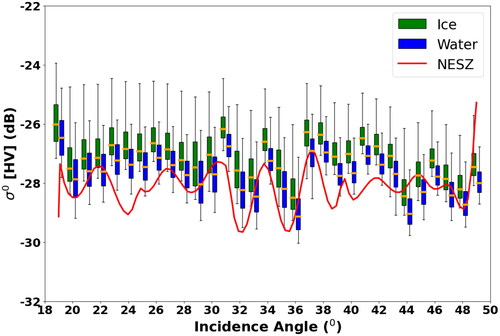
Figure 5. Convolutional neural network training and validation accuracy and binary cross-entropy loss function for each training epoch for the 4-bands input model ().
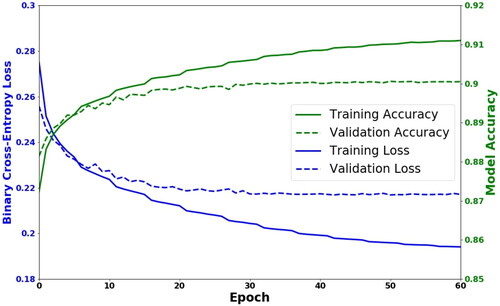
Table 4. Training and validation accuracies based on SAR input parameterization and different input layers.
Figure 6. 4-band input model () predictions distribution per incidence angle. Orange line is the median, boxes correspond to the 1st and 3rd quartile and whiskers represent the 5th and 95th percentile.
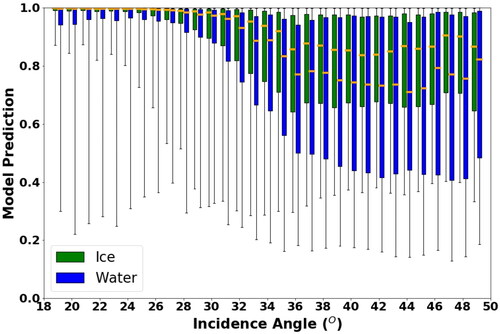
Table 5. CNN training, validation and overall accuracies for ice and water classes independently and combined for the 4-input layer model ().
Figure 7. (a) CIS regional chart valid July 13, 2020; (b) ASI SIC product of July 13, 2020; (c) MODIS Terra image of July 14; (d) RSAT-2 RGB: HH-HV-HV composite image of July 13,2020; and (e) CNN model output for July 13, 2020.
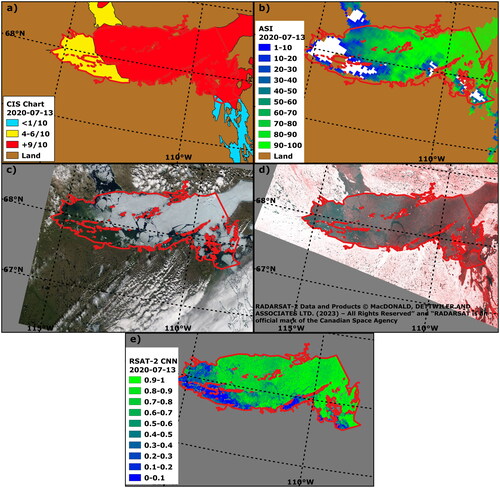
Figure 8. Timeseries of weekly SIC for all of Coronation Gulf from the CIS regional charts, ASI passive microwave product and output of the RSAT-2 images using the 4-band input CNN model. The values are valid on the Monday for each week. The ASI and RSAT-2 products consist of weekly pixel average.
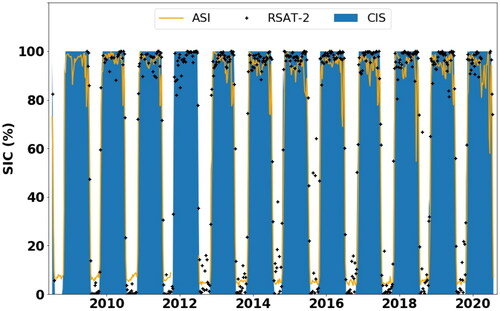
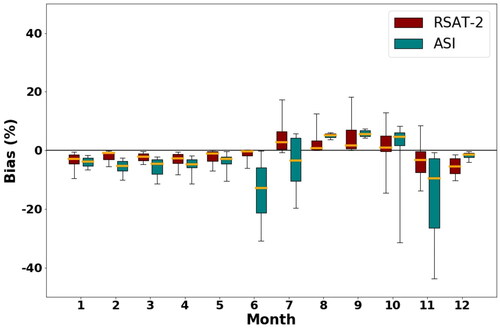
Figure 9. Box plot of the weekly SIC biases from for each month for the entire time series. The CIS charts were taken as reference for the bias calculation.