
Figures & data
Figure 1. National Terrestrial Ecosystem Monitoring System (NTEMS) 30-m land cover map representing the Hudson Plains Ecozone, 2018 (Hermosilla et al. Citation2022, Citation2018).
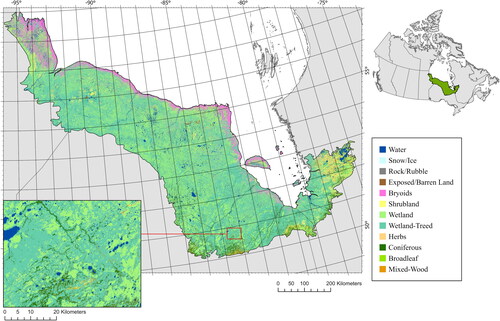
Table 1. Input data sources Sentinel 3 SLSTR LST & NDVI are resampled using bilinear interpolation to match the spatial resolution and grid of SMAP L4C GPP.
Figure 2. 16-Day mean (2017/04/06 to 2017/04/22) LST (degrees Kelvin) (top-left), NDVI (bottom-left) for the Hudson Plains Ecozone (unstratified), combined following the TG concept into an initial estimate of TG GPP (g C m−2 day−1) (middle-right).
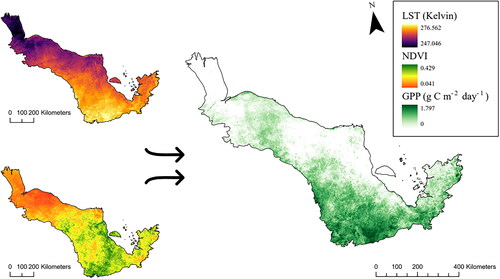
Figure 3. Estimated 16-day mean Gross Primary Productivity (GPP) per stratified land cover type across the Hudson Plains (2018 & 2019), where A = Coniferous > 70% (n = 598), B = Mixed-Wood > 70% (n = 6,440), C = Wetland-Treed > 70% (n = 84,318), and D = Wetlands > 70% (n = 9,016).
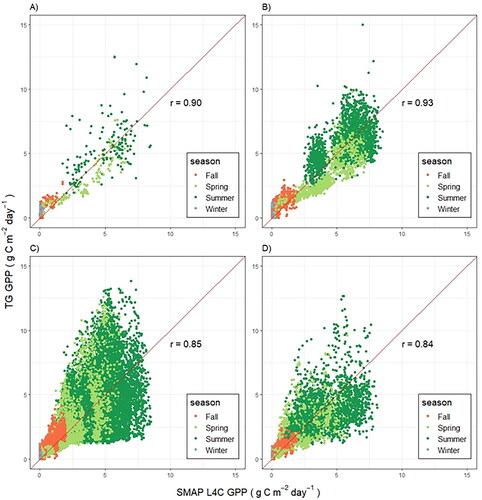
Figure 4. Temporal variation of 16 day mean Gross Primary Productivity (GPP), averaged per stratified land cover type across the Hudson Plains (2018 & 2019) predicted by SMAP L4C or the adapted TG model. A = Coniferous > 70%, B = Mixed-Wood > 70%, C = Wetland-Treed > 70%, and D = Wetlands > 70%.
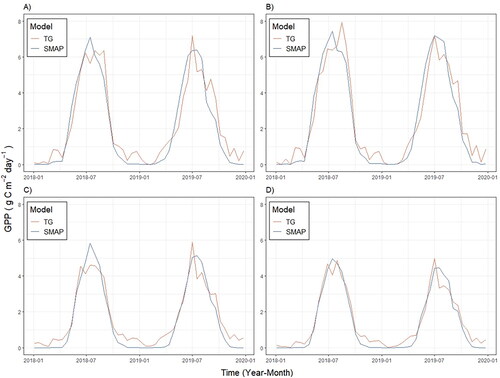
Figure 5. General trends of over and under-prediction of seasonal GPP per the adapted TG model, relative to SMAP L4C GPP based on model performance shown in .
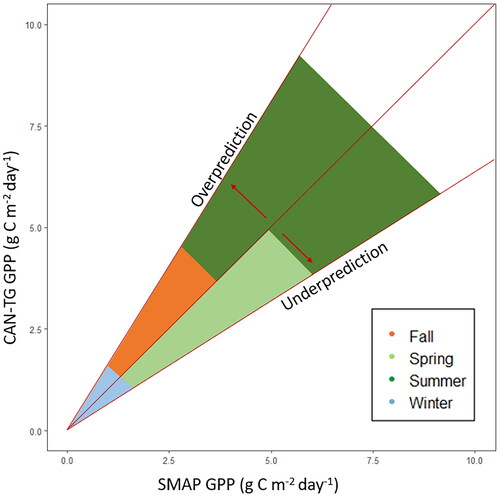
Figure 6. Proposed Model Framework Structure for CAN-TG. Red boxed indicate primary and secondary data sources. Green box indicates National Terrestrial Ecosystem Monitoring System (NTEMS) land cover attribution information.
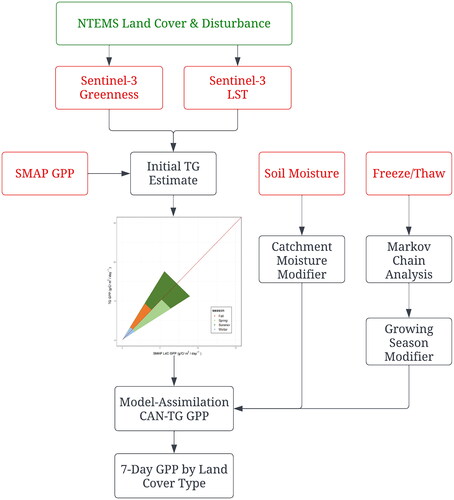
Table 2. Primary data sources for proposed modeling framework.