Figures & data
Figure 1. (a) Location of the study area (blue polygon) in the United States, and distribution of evergreen forest (in red) according to National Land Cover Database (NLCD) 2019, (b) a sample site of grassland with evergreen forest encroachment, and (c) a sample site of pure grassland.
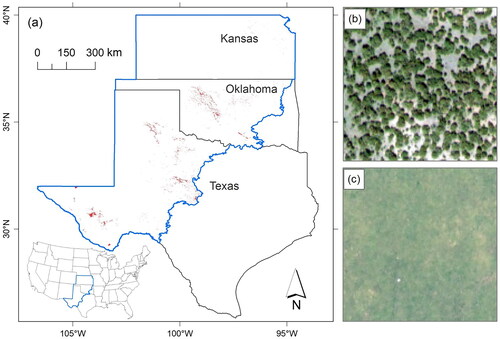
Figure 2. (a) Annual precipitation in 2019 and (b) annual mean air temperature in 2019 across the study area.
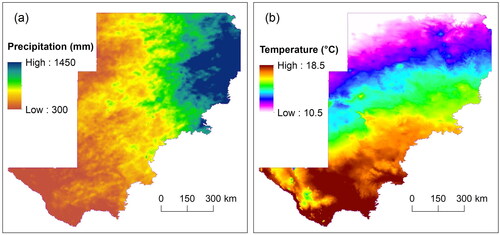
Figure 3. Scatterplots for the year 2019. (a) Annual GPP change ratio versus annual ET change ratio, (b) annual GPP change ratio versus annual EWUE change ratio, and (c) annual ET change ratio versus annual EWUE change ratio. Linear regression lines and details are overlaid on respective scatterplots.
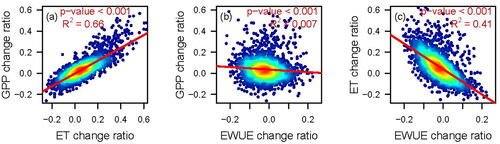
Figure 4. Scatterplots for the year 2019. Annual GPP change ratio versus (a) evergreen forest coverage, (b) annual precipitation, and (c) annual mean air temperature. Linear regression lines and details are overlaid on respective scatterplots.
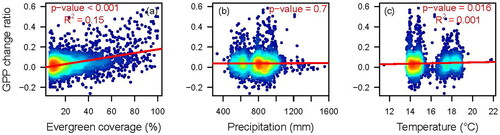
Figure 5. Scatterplots for the year 2019. Annual ET change ratio versus (a) evergreen forest coverage, (b) annual precipitation, and (c) annual mean air temperature. Linear regression lines and details are overlaid on respective scatterplots.
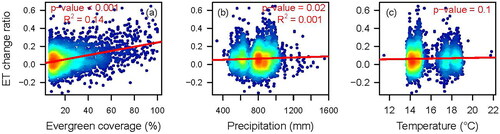
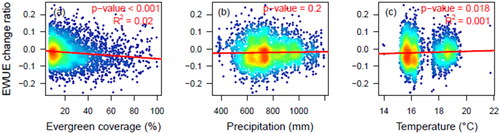
Figure 6. Scatterplots for the year 2019. Annual EWUE change ratio versus (a) evergreen forest coverage, (b) annual precipitation, and (c) annual mean air temperature. Linear regression lines and details are overlaid on respective scatterplots.
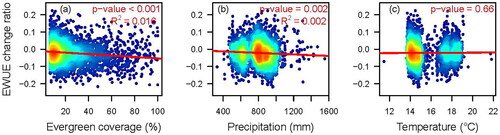
Figure A1. Distribution of sample grassland pixels with evergreen forest encroachment in the four study years.
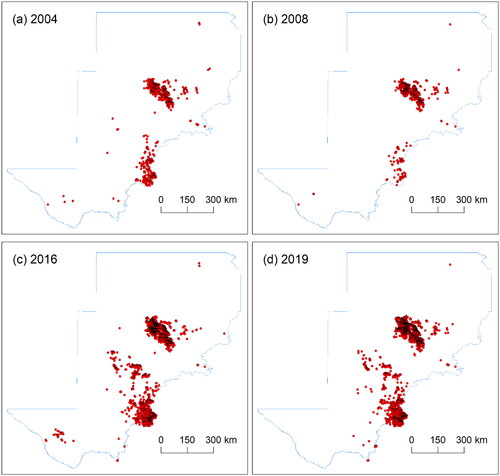
Figure A2. Scatterplots for the year 2004. (a) Annual GPP change ratio versus annual ET change ratio, (b) annual GPP change ratio versus annual EWUE change ratio, and (c) annual ET change ratio versus annual EWUE change ratio.
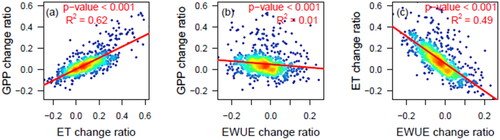
Figure A3. Scatterplots for the year 2008. (a) Annual GPP change ratio versus annual ET change ratio, (b) annual GPP change ratio versus annual EWUE change ratio, and (c) annual ET change ratio versus annual EWUE change ratio.
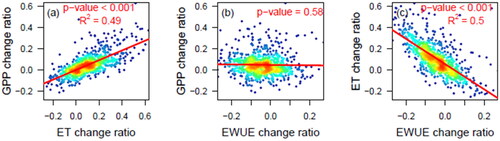
Figure A4. Scatterplots for the year 2016. (a) Annual GPP change ratio versus annual ET change ratio, (b) annual GPP change ratio versus annual EWUE change ratio, and (c) annual ET change ratio versus annual EWUE change ratio.
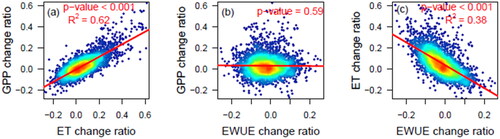
Figure A5. Scatterplots of 2004 annual GPP change ratio versus (a) evergreen forest coverage, (b) annual precipitation, and (c) annual mean air temperature.
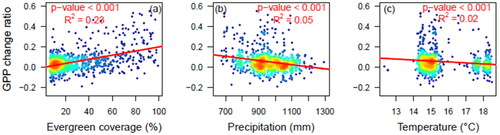
Figure A6. Scatterplots of 2008 annual GPP change ratio versus (a) evergreen forest coverage, (b) annual precipitation, and (c) annual mean air temperature.
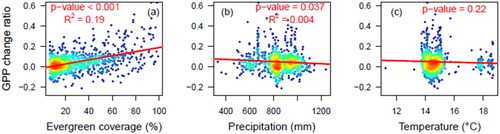
Figure A7. Scatterplots of 2016 annual GPP change ratio versus (a) evergreen forest coverage, (b) annual precipitation, and (c) annual mean air temperature.
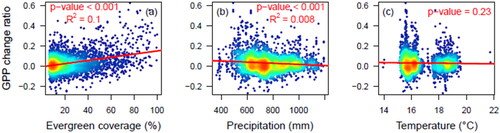
Figure A8. Scatterplots of 2004 annual ET change ratio versus (a) evergreen forest coverage, (b) annual precipitation, and (c) annual mean air temperature.
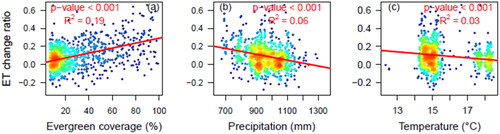
Figure A9. Scatterplots of 2008 annual ET change ratio versus (a) evergreen forest coverage, (b) annual precipitation, and (c) annual mean air temperature.
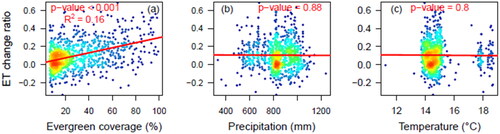
Figure A10. Scatterplots of 2016 annual ET change ratio versus (a) evergreen forest coverage, (b) annual precipitation, and (c) annual mean air temperature.
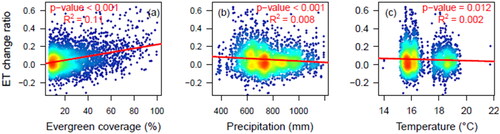
Figure A11. Scatterplots of 2004 annual EWUE change ratio versus (a) evergreen forest coverage, (b) annual precipitation, and (c) annual mean air temperature.
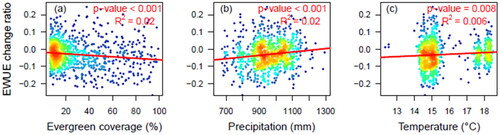
Figure A12. Scatterplots of 2008 annual EWUE change ratio versus (a) evergreen forest coverage, (b) annual precipitation, and (c) annual mean air temperature.
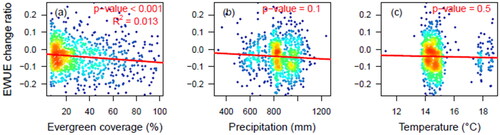
Figure A13. Scatterplots of 2016 annual EWUE change ratio versus (a) evergreen forest coverage, (b) annual precipitation, and (c) annual mean air temperature.