Figures & data
Figure 1. A map showing the province of Nova Scotia, with the Goldenville and Halifax formations overlaid. These are the main gold-bearing formations in the province.
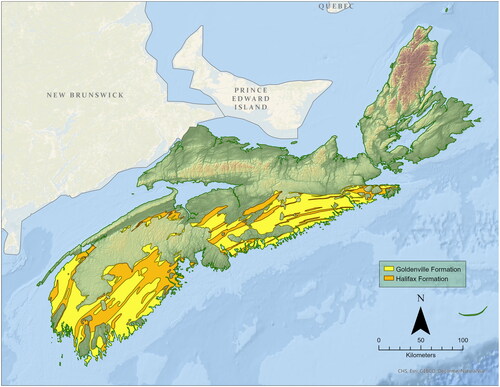
Figure 2. A sample of a natural color Sentinel-2 image at 20 m resolution. The image shows the Montague Historic Gold Mine District as well as tailings areas polygons from the Nova Scotia Mine Tailings Database.
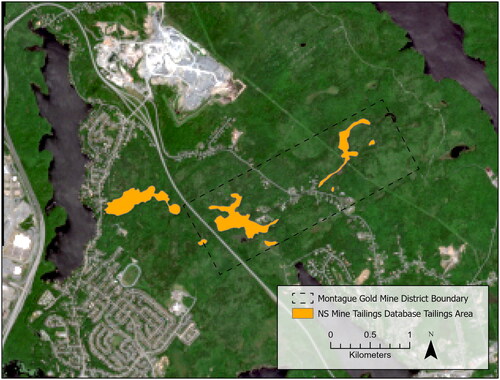
Figure 3. Box and whisker plot displaying F1-score at two districts. Values are spread out along the x-axis for clarity. The pixel-wise classification model was run 50 times each on Sentinel-2 images for the Goldenville and Montague regions, respectively.
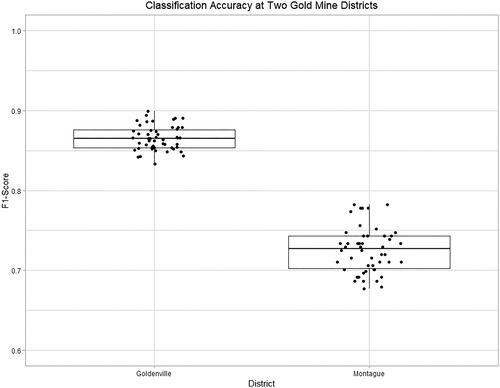
Figure 4. (a) Pixel-wise classifier at Goldenville displayed as a frequency. The model was run 50 times using a Sentinel-2 image, and the total count of positive classifications (i.e., the pixel was labeled as tailings by the classifier) is displayed in a range from 1 to 50. Where the basemap (satellite image) is shown, that pixel was never classified as tailings, and the count is 0. Image credit: Maxar. (b) Pixel-wise classifier at Montague displayed as a frequency. The model was run 50 times using a Sentinel-2 image, and the total count of positive classifications (i.e., the pixel was labeled as tailings by the classifier) is displayed in a range from 1 to 50. Where the basemap (satellite image) is shown, that pixel was never classified as tailings, and the count is 0. Image credit: Maxar.
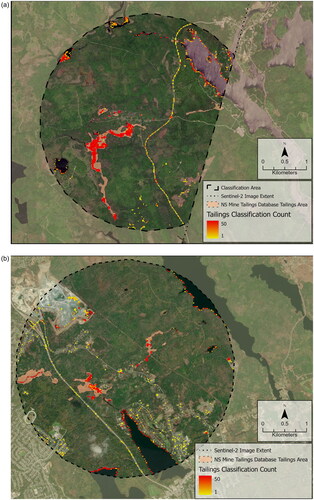
Figure 5. A map showing five sample sites in estuaries downstream of historic mine districts. All samples were collected in low energy areas, and are in the same watershed.
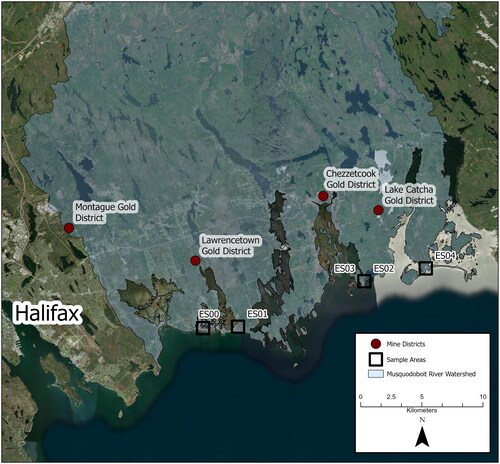
Table 1. A description of tailings samples collected from four coastal locations.
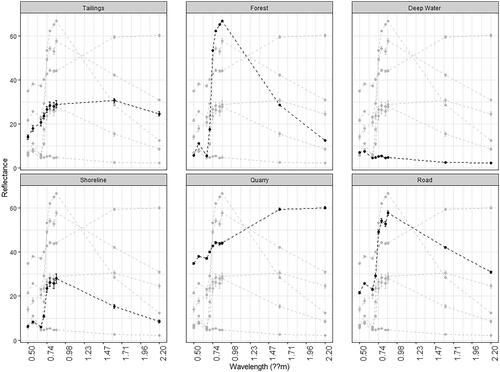
Figure 6. An array of biplots showing the mean spectrum of randomly sampled points from six coastal and wetland areas. These areas share sedimentary characteristics with pixels that produced false positives in the classifier. Each box shows one spectrum with the other spectra in light grey for comparison. The x value of points indicates the central wavelength of Sentinel-2 bands. Vertical whiskers around points indicate the standard error at that band. These land cover types were often misclassified as tailings by our model.
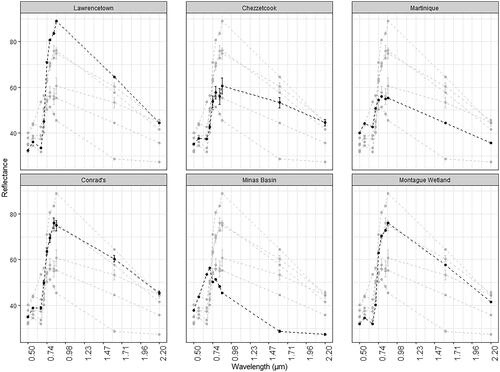
Table 2. Sentinel-2 10 and 20 m bands, with bandwidth and band center.
Figure 7. An array of biplots showing the mean spectrum for six land cover types found around the Montague mine district. Each box shows one spectrum with the other spectra in light grey for comparison. The x value of points indicates the central wavelength of Sentinel-2 bands. Whiskers around points indicate the standard error at that band. Similar spectra, at least for a certain wavelength range, were more likely to be confused when classifying. Tailings and shorelines were the most often confused classes. Absorption at Band 4 (third point from left) indicates potential chlorophyll absorption resulting from vegetation within pixels.