
Figures & data
Figure 1. A street view (left) and its semantic segmentation map (right) (Cityscapes dataset).
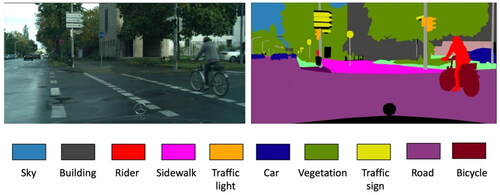
Figure 2. Imbalanced class distribution in the Cityscapes dataset.
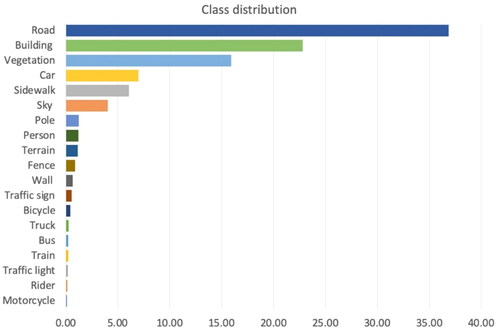
Figure 3. Scene examples from the Cityspaces dataset.
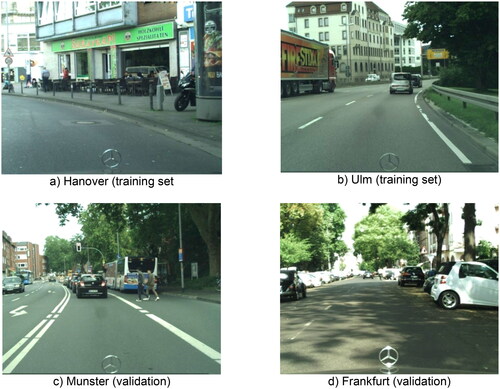
Figure 4. Class distribution in the Cityscapes training set.
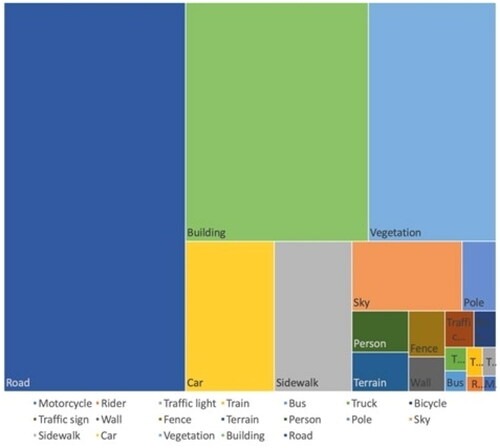
Figure 5. A scene (left) and its semantic segmentation map (right) (GTAv dataset).
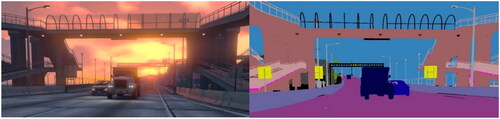
Figure 6. The architecture of end-to-end Active Reinforcement Learning model.
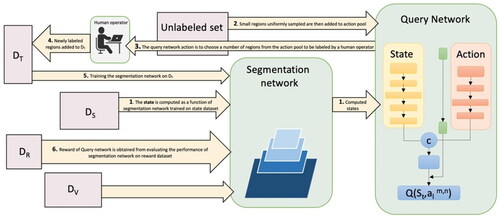
Figure 7. Query network architecture.
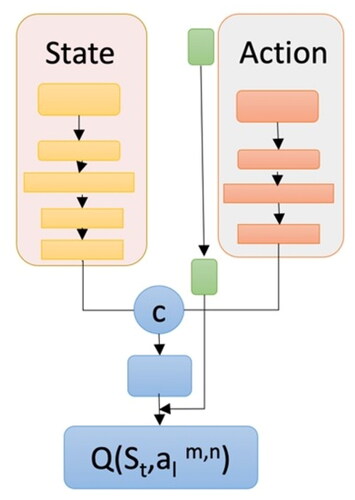
Figure 8. Intersection over union.
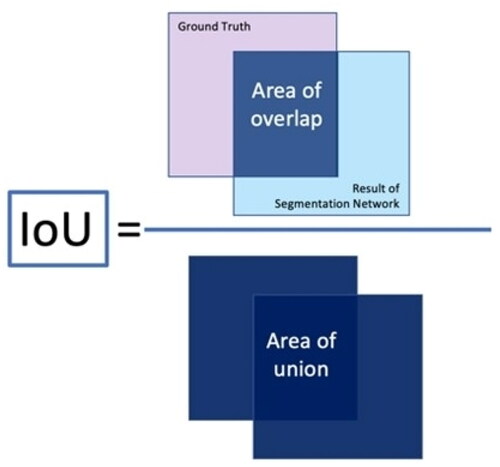
Figure 9. Implementation flowchart.
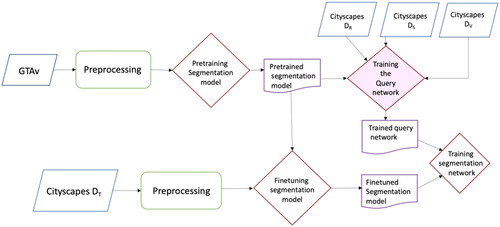
Table 1. The Cityscapes dataset partition.
Table 2. Pretraining details.
Figure 10. Pre-training FPN, DeepLabV3, and DeepLabV3+ segmentation networks on GTAv synthetic dataset.
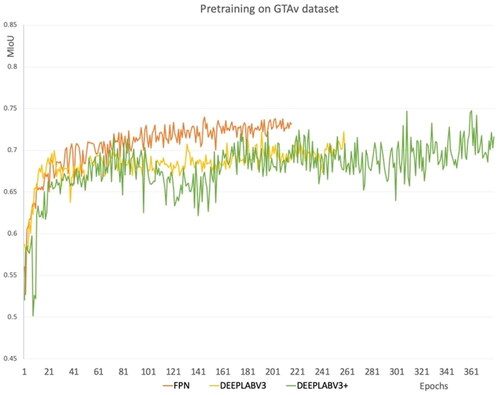
Figure 11. Fine-tuning on Dt subset.
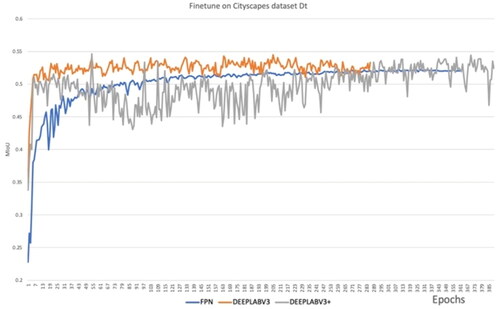
Table 3. Fine-tuning details.
Table 4. Percentage of region numbers from all of the dataset.
Table 5. Comparison of performance of the FPN network across various methods with different budgets (MIoU).
Figure 12. Performance of our method with the FPN segmentation network compared to baselines.
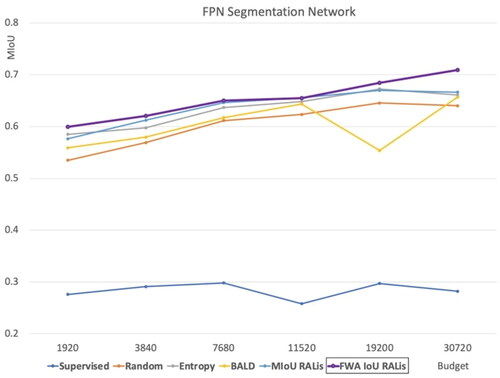
Figure 13. The performance of the RALis method rewarded by MIoU and FWA IoU.
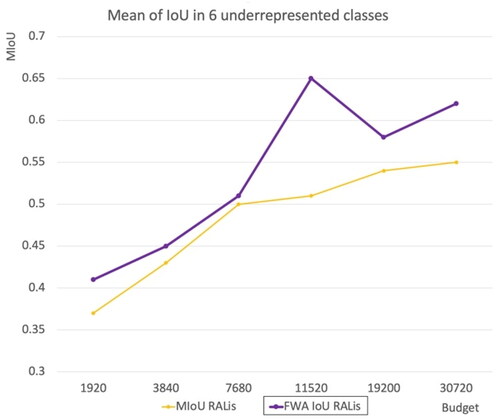
Table 6. Performance of our method on six underrepresented classes (MIoU).
Figure 14. Our RALis method with DeepLabV3 segmentation network in comparison to other baselines.
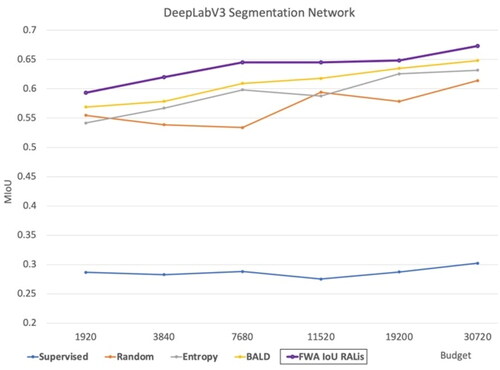
Table 7. The comparison of performance of the DeepLabV3 network across various methods with different budgets (MIoU).
Figure 15. RALis method with a DeepLabV3+ segmentation network in comparison to other baselines.
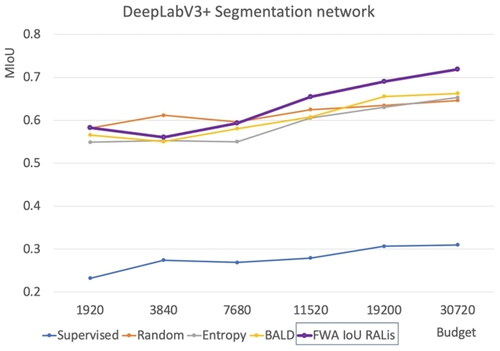
Table 8. The comparison of performance of the DeepLabV3 network across various methods with different budgets (MIoU).
Figure 16. The segmentation models are trained on all of the Cityscapes dataset, containing 2975 images. The results are compared to IoU for validation.
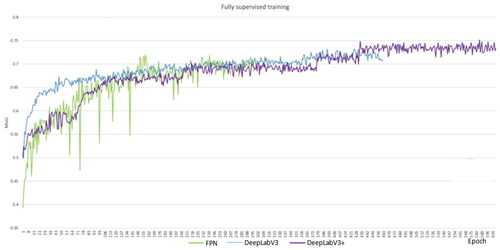
Figure 17. A comparison of the performance of the RALis method rewarded with weighted IoU.
Table 9. The performance of supervised and FWA RALis methods across three networks (MIoU).
Table 10. The performance of baselines and RALis method across three networks with 8% budget of all data (MIoU).