
Figures & data
Figure 1. Study area of 2018, 2019 field measurements and airborne lidar transects in the Taiga Plains and Taiga Shield ecozones, Northwest Territories, Canada. Field measurements were used to develop aboveground biomass models based on the coincident 2018, 2019 Titan lidar data. Models were then transferred to the 2007, 2010 ALTM 3100 lidar data. (Ecozone and ecoregion boundaries were derived from the National Ecological Framework for Canada dataset).
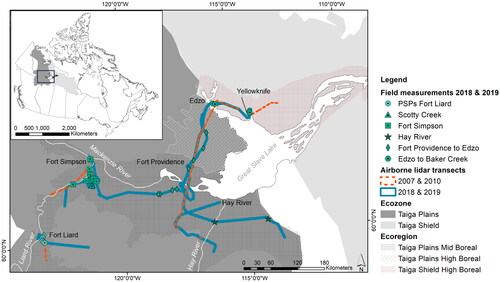
Table 1. Stem length-based regression coefficient estimates with error statistics to be input into Equation (4)–(7) (Flade et al. Citation2020) for linear logarithmic regression with correction (LLRC) and iterative nonlinear least squares regression (NLS) as appropriate to derive short-stature tree AGB (≤4.5 m height).
Table 2. Lidar survey settings and configuration of the single channel ALTM 3100 and multi-channel Titan sensors.
Table 3. Descriptive statistic of field-derived AGB (Mg ha−1) for the complete field data and stratified into ecozone and ecosystem type.
Table 4. Pearson correlation coefficient of linear relationships between Titan lidar metrics and field-based AGB within corresponding plots used to refine the selection of lidar metrics for lidar-based stratum specific and general AGB model development.
Table 5. Titan lidar height metrics after pre-selection, regression coefficients and leave-one-out cross validated model fits for stratum-specific and general AGB models using single variable nonlinear least squares regression via a power function.
Figure 2. Field-derived aboveground biomass (AGB) related to lidar height metrics (m) for all strata combined using iterative nonlinear least squares regression via a power function illustrated within the 95th confidence interval (CI) and 95th prediction interval (PI).
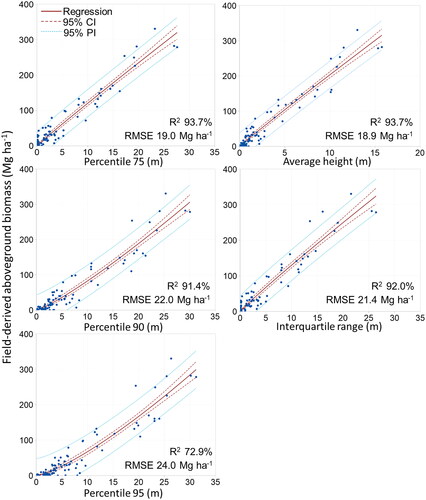
Table 6. General AGB model fits per Titan lidar height metric evaluated for stratum-specific Taiga ecoregions and ecosystem types.
Table 7. Covariances between corresponding multi-channel Titan (observed) and single channel ALTM 3100 (predicted) lidar height metrics.
Figure 3. Covariance of Titan (observed) and ALTM 3100 (predicted) lidar height metrics to evaluate potential for systematic error during aboveground biomass model transfer based on 558 randomly selected grid cells in late successional upland forests. Slopes are represented as percent deviation of a 1:1 relationship (dSlope).
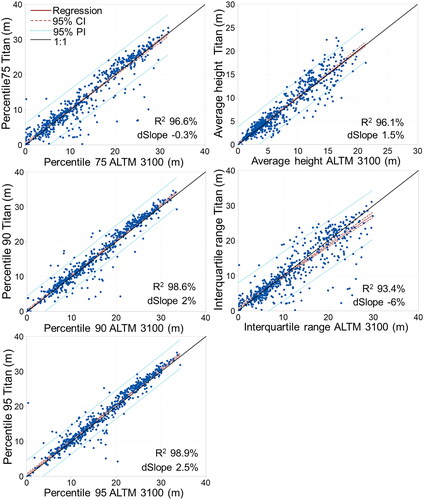
Figure 4. Covariance of Titan (observed) and ALTM 3100 (predicted) aboveground biomass (AGB) to evaluate the optimal lidar height metric as predictor of bi-temporal shrub-to-tree AGB across different ecozones, ecosystem types, and ALTM sensors based on 1381 randomly selected grid cells. Residuals of modeled AGB (ALTM 3100) per lidar height metric (average height (average), 75th and 90th height percentile (p75 and p90)) are presented on the right column.
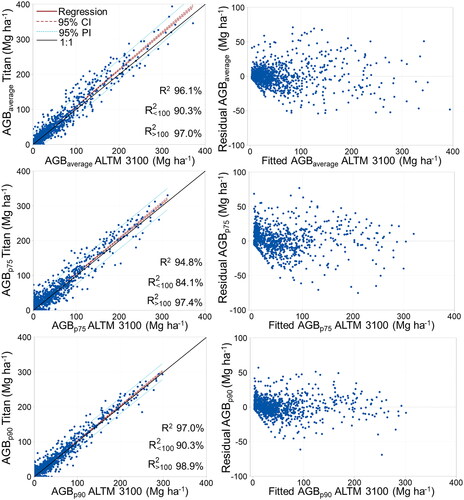
Table 8. Final bi-temporal shrub-to-tree AGB model evaluated for all strata combined and for stratum-specific Taiga ecoregions and ecosystem types.