Figures & data
Fig. 1 Locations of the Foothills Climate Array (FCA) monitoring sites, 2004–10 and the geographic position of the FCA in southwestern Alberta, Canada (inset).
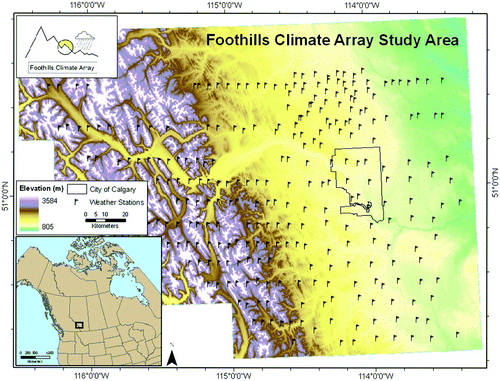
Fig. 2 FCA site distributions (panels on the right) and DEM-derived terrain distributions (panels on the left) in the study region: (a and b) elevation, (c and d) slope, and (e and f) aspect (adapted from Wood (2008) by permission of the author).
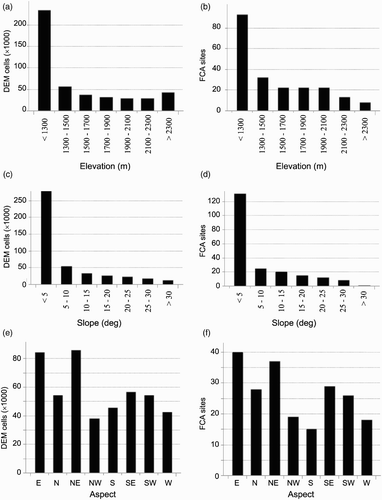
Table 1. Meteorological station site distributions. Elevation is in kilometres above sea level.
Fig. 3 Sample photos of FCA weather stations in the project: a) agricultural region west of Airdrie; b) agricultural region west of Longview; c) agricultural region west of Madden; d) Moose Mountain, Kananaskis Country; e) Mt. Evan Thomas, Kananaskis Country (reproduced from Fargey (Citation2007) by permission of the author).
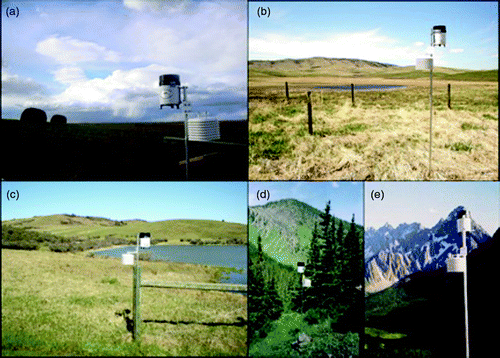
Fig. 4 a) Comparison of daily average temperatures from the Environment Canada Calgary Airport station (YYC, black line) and the nearest FCA site, at the Calgary Airport fire station (FCA0334, red line). b) Temperature difference between the sites (T 0334 – T YYC) versus mean daily temperature. Data covers 1651 days from 3 May 2005 to 30 September 2009. The mean offset is +0.49°C.
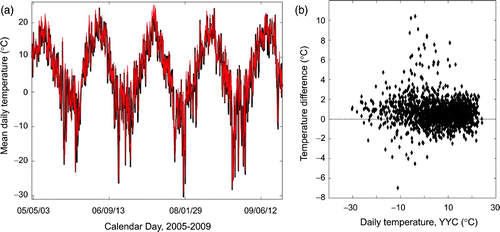
Table 2. Mean seasonal and annual temperatures in the region for 2005–09 (°C). Banff and Calgary are Environment Canada stations, at 1084 m and 1397 m, respectively. Standard deviations refer to the daily mean temperatures in each season. Minimum and maximum temperatures reported are the average (2005–09) of extreme annual minima and maxima. Results are also given for the FCA sites most proximal to the Banff and Calgary Environment Canada sites, FCA0312 (1642 m) and FCA0334 (in the city of Calgary, 1087 m), and for the coldest site in the grid, FCA0313 (Mt. Rundle, Banff National Park, 2910 m).
Fig. 5 Mean seasonal temperature patterns. a) spring (MAM), b) summer (JJA), c) autumn (SON) and d) winter (DJF). City of Calgary is outlined with a thick black line; FCA sites indicated with black dots.
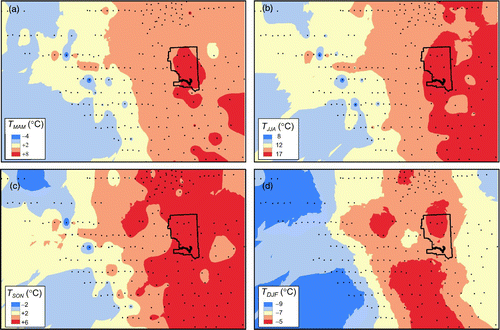
Fig. 6 Distribution of daily temperatures at all stations in the FCA grid, 2005–09. Mean temperatures in a) spring (MAM), b) summer (JJA), c) autumn (SON) and d) winter (DJF). Extreme e) minimum and f) maximum daily mean temperatures, averaged over the five years.
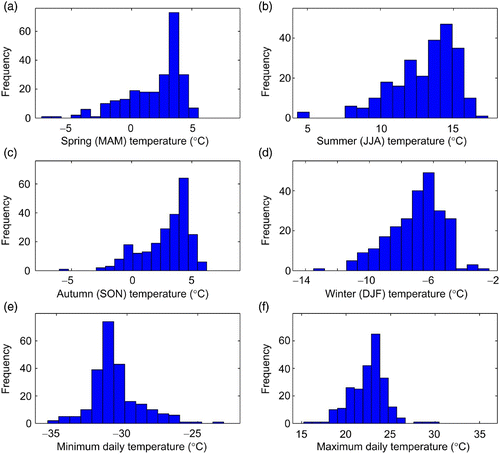
Fig. 7 Standard deviation of temperature at all FCA sites. a) Map view of winter temperature variability. b) annual and c) winter (DJF) standard deviation versus elevation. Data are based on daily mean temperatures from 2005–09. City of Calgary is outlined with a thick black line; FCA sites indicated with black dots.
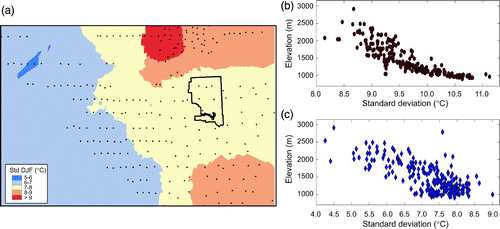
Fig. 8 Mean annual (a and b) and mean winter (c and d) (DJF) temperature versus elevation for 2005–09. All FCA sites (a and c). Data averaged in 100 m elevation bins (b and d), giving less weight to the large number of low-elevation sites. Linear fits to the data correspond to the linear lapse rates (β) of (with a slope of dz/dT = 1/β in these plots).
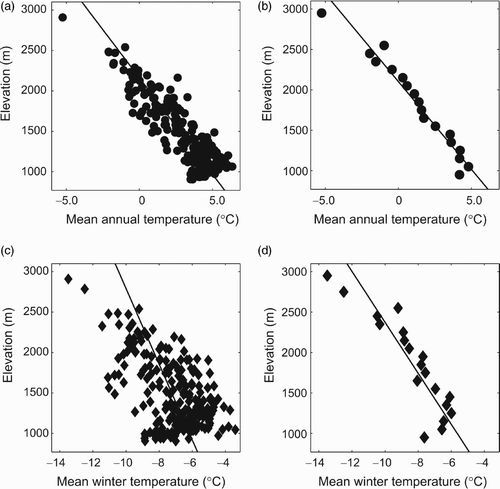
Table 3. Monthly, seasonal and annual near-surface temperature lapse rates (°C km−1) for 2005–09, calculated by linear regression of temperature as a function of elevation for the full set of data and for means of temperature data in 100 m elevation bins.
Fig. 9 Monthly (a) elevation coefficients and (b) mean absolute errors for the univariate or “standard lapse rate” model (temperature as a function of elevation; dark grey bars) and the multivariate regression model (light grey bars).
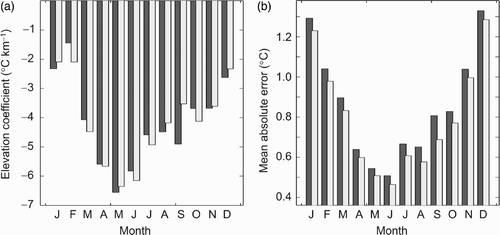
Table 4. Multivariate regression model coefficients and performance (adjusted R 2 and mean absolute error in the modelled monthly temperature at all sites, | ε |). Italicized numbers are significant at the 95% confidence level.
Fig. 10 Sample meteorological conditions during prominent chinook (panels on the left) and continental polar air mass (panels on the right) incursions in the study region: air temperature (a and b); 500 mb heights (c and d); surface air pressure (e and f), standardized to sea level; and surface zonal (westerly) wind speed (g and h). All plots are mean daily snapshots, with the chinook event on 13 January 2008 and the cold air mass on 29 January 2008. The insets in (g) and (h) denote the study region (NOAA, Citation2010).
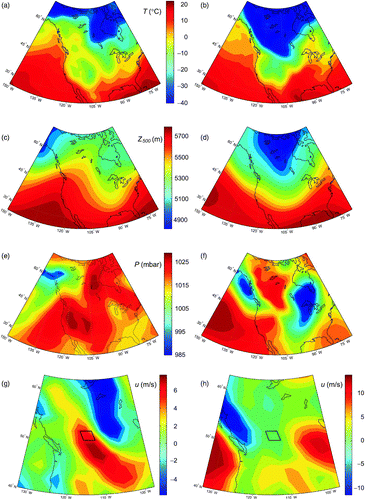
Fig. 11 Composite of chinook (panels on the left) and continental polar (panels on the right) temperature anomalies in the region: (a) mean temperature from 102 winter chinook events for 2005–09; (b) mean temperature from 102 cold air mass incursions for 2005–09; and (c) and (d) plot temperature anomalies relative to the mean winter temperatures. City of Calgary is outlined with a thick black line; FCA sites indicated with black dots.
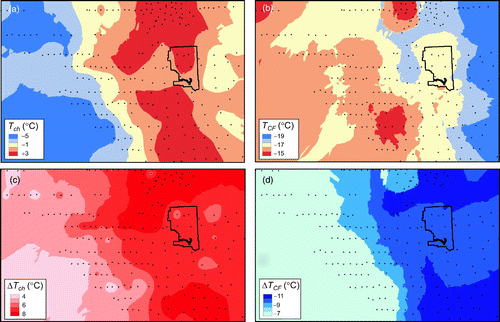
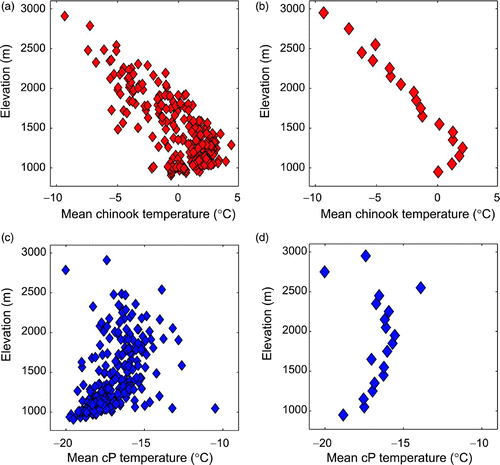
Fig. 12 Mean (composite) temperatures versus elevation for 2005–09 when the region was experiencing chinook (a and b) and continental polar (cP) air mass weather systems (c and d); all FCA sites (a and c); and data averaged for 100 m elevation bins (b and d), giving less weight to the large number of low-elevation sites.