1,572
Views
28
CrossRef citations to date
0
Altmetric
Fundamental Research / Recherche fondamentale

Flow Constraints on Pathways through the Canadian Arctic Archipelago

, , &
Pages 373-385 | Received 04 May 2011, Accepted 08 Feb 2012, Published online: 30 Jul 2012

Figures & data

Fig. 1 The name of the islands, straits and locations in the model domain, AG: Amundsen Gulf, B: Bellot Strait, D: Dolphin and Union Strait, BM: Byam Martin Channel, BaS: Barrow Strait, FH: Fury and Hecla Strait, FS: Franklin Strait, GB: Gulf of Boothia, LS: Lancaster Sound, JS: Jones Sound, MaS: Mackenzie Shelf, MC: M'Clintock Channel, MS: McClure Strait, NS: Nares Strait, Pe: Peel Sound, PS: Penny Strait, VMS: Viscount Melville Sound, VS: Victoria Strait, C: Cape Bathurst, CR: Clyde River, De: Devon Island, CI: Cornwallis Island, KW: King William Island, R: Resolute Bay, PP: Prince Patrick Island, PWI: Prince of Wales Island. PRI: Prince Regent Inlet, QEI: Queen Elizabeth Islands, SI: Somerset Island, The thick red line shows the location of a section in . MS, VMS, BaS, and LS constitute Parry Channel.
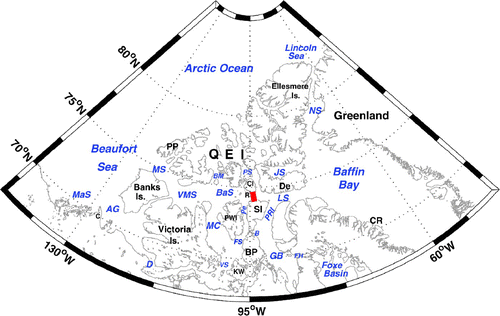
Fig. 1 The name of the islands, straits and locations in the model domain, AG: Amundsen Gulf, B: Bellot Strait, D: Dolphin and Union Strait, BM: Byam Martin Channel, BaS: Barrow Strait, FH: Fury and Hecla Strait, FS: Franklin Strait, GB: Gulf of Boothia, LS: Lancaster Sound, JS: Jones Sound, MaS: Mackenzie Shelf, MC: M'Clintock Channel, MS: McClure Strait, NS: Nares Strait, Pe: Peel Sound, PS: Penny Strait, VMS: Viscount Melville Sound, VS: Victoria Strait, C: Cape Bathurst, CR: Clyde River, De: Devon Island, CI: Cornwallis Island, KW: King William Island, R: Resolute Bay, PP: Prince Patrick Island, PWI: Prince of Wales Island. PRI: Prince Regent Inlet, QEI: Queen Elizabeth Islands, SI: Somerset Island, The thick red line shows the location of a section in Fig. 8. MS, VMS, BaS, and LS constitute Parry Channel.

Fig. 2 (a) The CAA configuration and (b) The pan-Arctic configuration with the background bathymetry (m).
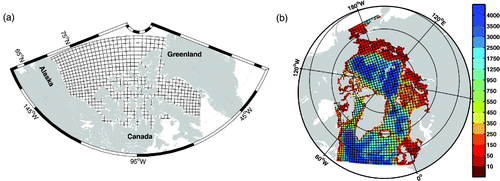
Fig. 2 (a) The CAA configuration and (b) The pan-Arctic configuration with the background bathymetry (m).

Fig. 3 Bathymetry (m) in the (a) CAA control experiment, (b) the CAA-MC experiment, (c) the CAA-FS experiment and (d) the CAA-BS experiment.
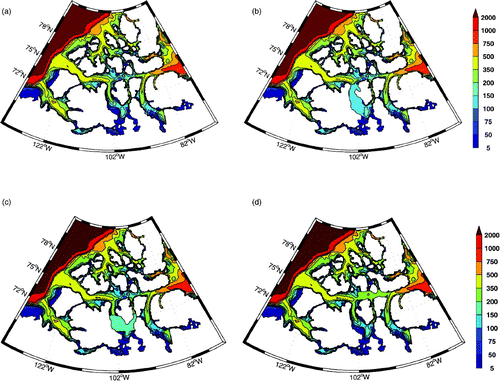
Fig. 3 Bathymetry (m) in the (a) CAA control experiment, (b) the CAA-MC experiment, (c) the CAA-FS experiment and (d) the CAA-BS experiment.

Table 1. Details of the model configurations and experiments used in the paper.

Fig. 4 Downwelling shortwave radiation (W m−2) in June (a) from the Arctic Global Radiation dataset, (b) from the Large and Yeager (Citation2004) dataset. (c) The difference between the AGR dataset and the Large and Yeager (2004) dataset for June.
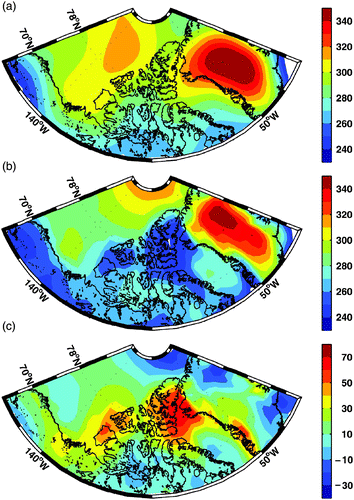
Fig. 4 Downwelling shortwave radiation (W m−2) in June (a) from the Arctic Global Radiation dataset, (b) from the Large and Yeager (Citation2004) dataset. (c) The difference between the AGR dataset and the Large and Yeager (2004) dataset for June.

Table 2. List of the six numerical experiments.

Fig. 5 (a) Mean sea-ice concentration in July for the period 1984–2004 from SSM/I data. (b) Simulated mean sea-ice concentration in July and (c) mean sea-ice thickness (m) in April averaged over years 6–8 in the CAA control experiment.
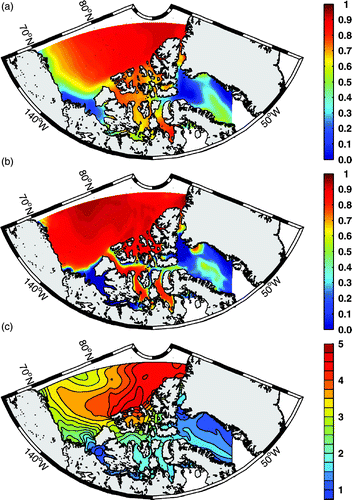
Fig. 5 (a) Mean sea-ice concentration in July for the period 1984–2004 from SSM/I data. (b) Simulated mean sea-ice concentration in July and (c) mean sea-ice thickness (m) in April averaged over years 6–8 in the CAA control experiment.

Table 3. Observed ice thickness and modelled ice thickness (m).

Fig. 6 (a) The mean currents in the CAA averaged over the top 300 m and over years 6–8 in the CAA control experiment, with one-fifth of the horizontal grid points shown. An enlargement of the inset box is shown in . (b) as in (a) but for the pan-Arctic experiment averaged over years 16–18, with one-third of the horizontal grid points shown.
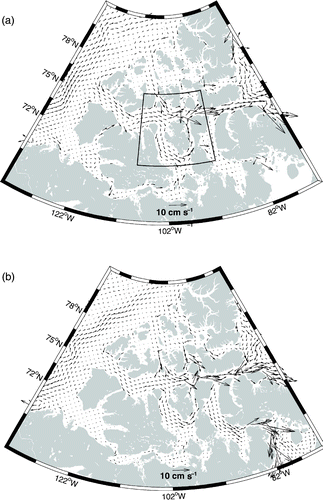
Fig. 6 (a) The mean currents in the CAA averaged over the top 300 m and over years 6–8 in the CAA control experiment, with one-fifth of the horizontal grid points shown. An enlargement of the inset box is shown in Fig. 7. (b) as in (a) but for the pan-Arctic experiment averaged over years 16–18, with one-third of the horizontal grid points shown.

Fig. 7 Enlargement of the inset area in a showing the currents. The background field is log10(f/h). The red line shows the position of line A, along which the momentum balance is averaged in .
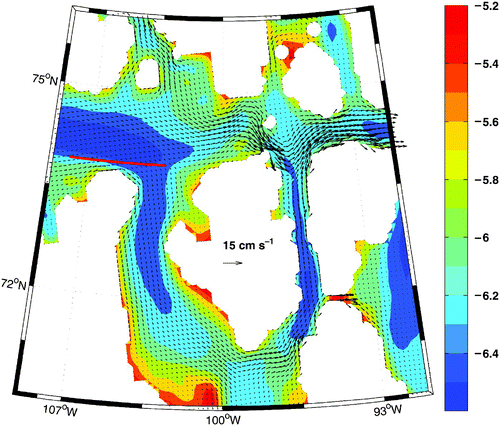
Fig. 7 Enlargement of the inset area in Fig. 6a showing the currents. The background field is log10(f/h). The red line shows the position of line A, along which the momentum balance is averaged in Fig. 10.

Fig. 8 The mean cross-section current speed (cm s−1) in Barrow Strait (section shown in ) in April averaged over years 6–8 in the CAA control experiment.
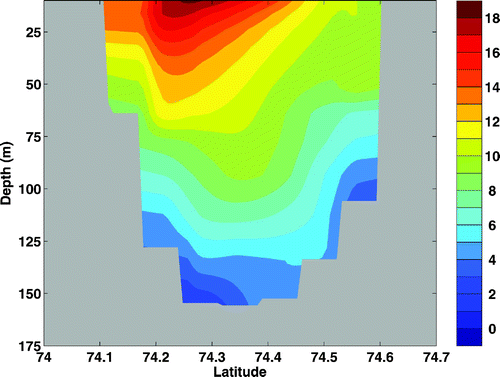
Fig. 8 The mean cross-section current speed (cm s−1) in Barrow Strait (section shown in Fig. 1) in April averaged over years 6–8 in the CAA control experiment.

Fig. 9 (a) The mean Ertel's potential vorticity and currents averaged over the top 300 m in eastern Lancaster Sound. (b) The cross-section current speed (cm s−1) at 81.4°W with the location of the section shown by the thick bold line in panel (c). (c) Surface salinity in eastern Lancaster Sound. (d) The vertical velocity (10−5 m s−1) (contours) over the top 140 m overlying Ertel's potential vorticity at 81.4°W. Downward velocity is negative. The units for Ertel's potential vorticity are 10−10 m−1 s−1. All values are averaged over years 16–18 in the pan-Arctic experiment.
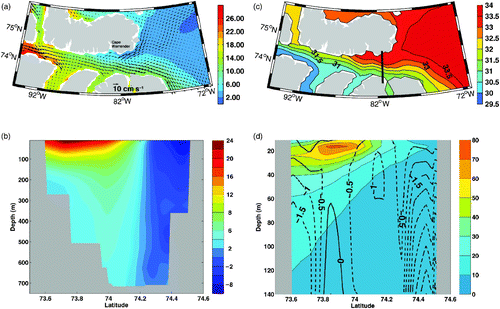
Fig. 9 (a) The mean Ertel's potential vorticity and currents averaged over the top 300 m in eastern Lancaster Sound. (b) The cross-section current speed (cm s−1) at 81.4°W with the location of the section shown by the thick bold line in panel (c). (c) Surface salinity in eastern Lancaster Sound. (d) The vertical velocity (10−5 m s−1) (contours) over the top 140 m overlying Ertel's potential vorticity at 81.4°W. Downward velocity is negative. The units for Ertel's potential vorticity are 10−10 m−1 s−1. All values are averaged over years 16–18 in the pan-Arctic experiment.

Fig. 10 Momentum balance averaged over the top 50 m along line A, shown in . Ageo represents ageostrophic acceleration. The values have been multiplied by 107.
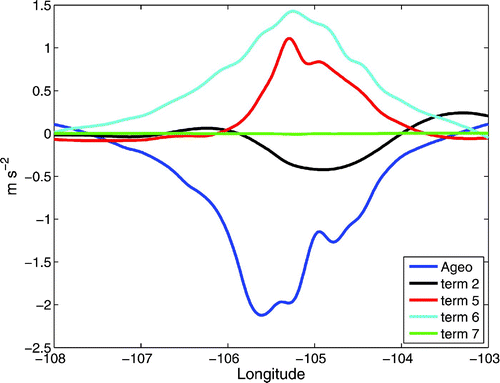
Fig. 10 Momentum balance averaged over the top 50 m along line A, shown in Fig. 7. Ageo represents ageostrophic acceleration. The values have been multiplied by 107.

Fig. 11 (a) The CAA control experiment ice concentration (color contours) and ice motion vectors (black arrows) and wind vectors (magenta arrows) in (a) August and (b) September.
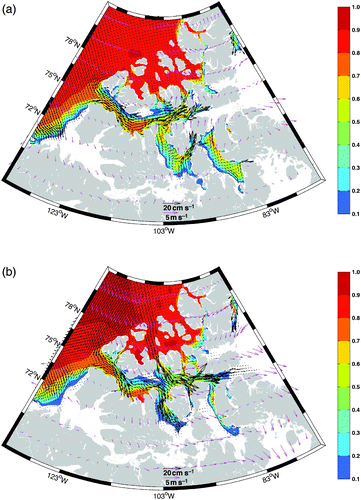
Fig. 11 (a) The CAA control experiment ice concentration (color contours) and ice motion vectors (black arrows) and wind vectors (magenta arrows) in (a) August and (b) September.

Reprints and Corporate Permissions

Please note: Selecting permissions does not provide access to the full text of the article, please see our help page How do I view content?

To request a reprint or corporate permissions for this article, please click on the relevant link below:

Academic Permissions

Please note: Selecting permissions does not provide access to the full text of the article, please see our help page How do I view content?

Obtain permissions instantly via Rightslink by clicking on the button below:

If you are unable to obtain permissions via Rightslink, please complete and submit this Permissions form. For more information, please visit our Permissions help page.