Figures & data
Fig. 1 Amplitude of model biases (AMB) of temperature (a) and salinity (b) as a function of depth from the control run without nudging (dashed line) and the control run with spectral nudging (thick solid line). Here, the AMB is calculated against the Levitus climatological temperature and salinity.
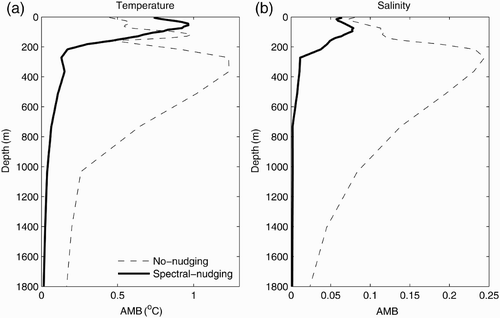
Fig. 2 Monthly Niño3.4 SST anomaly from the control run without spectral nudging (dotted line), the control run with spectral nudging (thick solid line) and from observations (thin solid line) for the period January 1985 to December 2004.
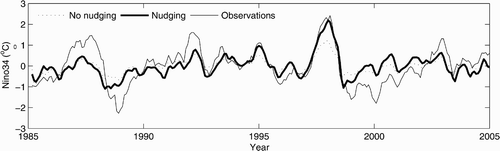
Fig. 3 Mean RMSEs of temperature (a, b), salinity (c, d), SLA (e) and surface zonal current (f) from the control run for the 2005–07 period; the observations are the BCTS profile data. The contour interval is 0.2°C for temperature, 0.05 for salinity, 0.05 m for SLA and 0.1 m s−1 for the zonal surface current.
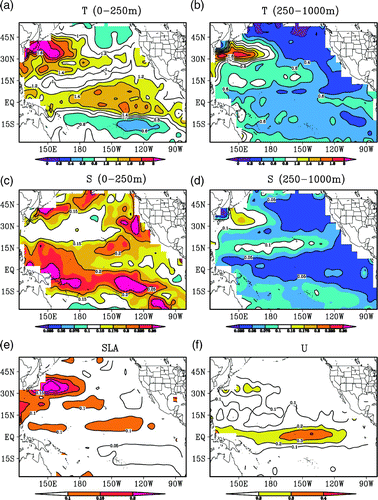
Fig. 4 Mean RMSEs of temperature (a) and salinity (b) averaged over the entire assimilation domain as a function of depth, from the control experiment (CTL, dotted black line), the standard EnKF assimilation (Exp1, thin red line), the 62-member time-averaged covariance experiment (Exp2, blue dashed line) and the 93-member time-averaged covariance experiment (Exp3, thick solid line); the observations are the BCTS profiles.
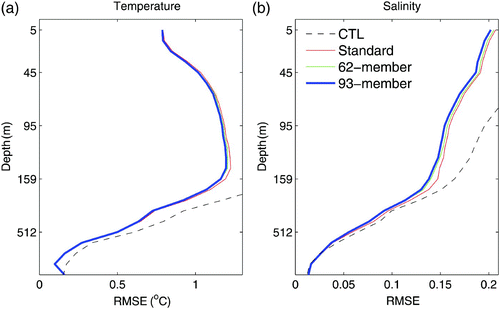
Fig. 5 Mean RMSEs of temperature (a, b), salinity (c, d), SLA (e) and surface zonal current (f) from Exp1 for the 2005–07 period; the observations are the BCTS profile data. The contour interval is 0.2°C for temperature, 0.05 for salinity, 0.05 m for SLA and 0.1 m s−1 for the zonal surface current.
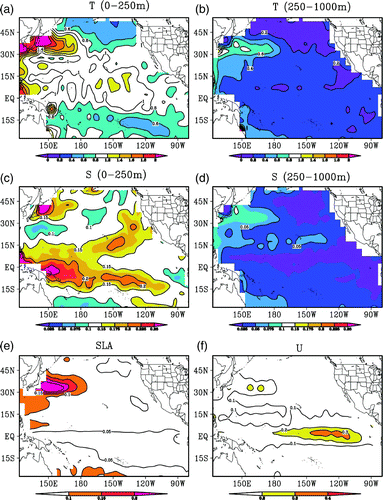
Fig. 6 Ratio, ℜ1 (%), of the mean RMSE differences between Exp3 and Exp1 to the RMSE of Exp1. The contour interval is 10%.
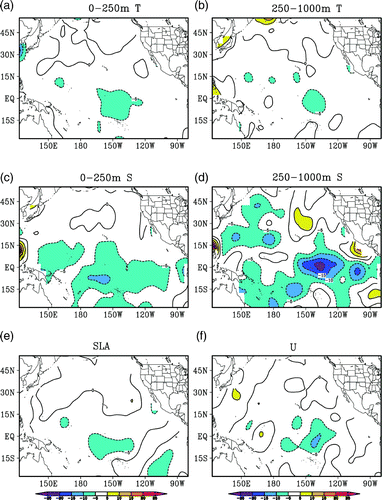
Fig. 7 Ratio, ℜ2 (%), of the ensemble spread to forecast RMSE, averaged over the top 250 m from Exp1 for T and S (a, b), and from Exp3 for T and S (c, d) as well as the differences in ℜ2 between Exp3 and Exp1 for T and S (e, f).
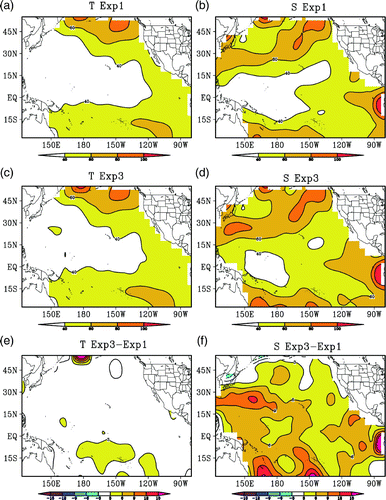
Fig. 8 Time series of the mean ℜ2 (%), averaged over the region 140°E–90°W, 10°S–10°N in the top 250 m, from Exp1 (red dashed line) and Exp3 (blue solid line), for (a) temperature and (b) salinity, for the first 100 assimilation steps.
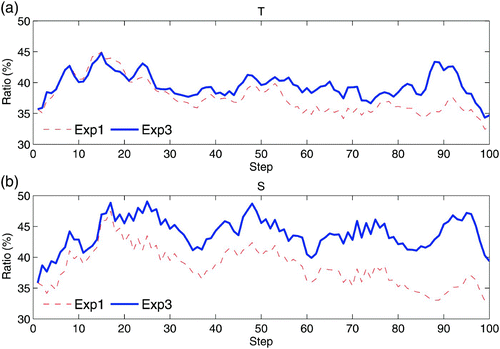
Fig. 9 Mean correlation functions of the temperature at the grid (140°W, 0°N, 150 m), against T (a–c), S (d–f), U (g–i) and SLA (j–l), obtained from Exp1 (left), Exp2 (middle) and Exp3 (right), averaged over the 2005–07 period. The contour interval is 0.2, and the correlations that pass the 0.90, 0.95 and 0.99 confidence level using a Student's t-test are shaded. The “+” marks the position of the grid.
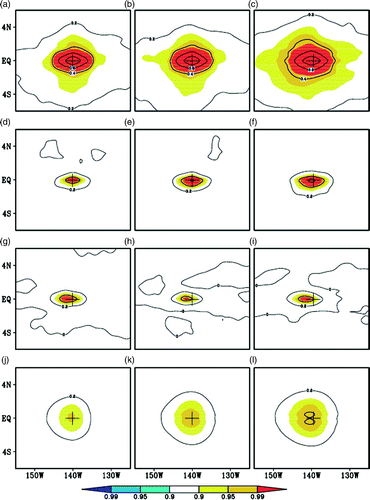
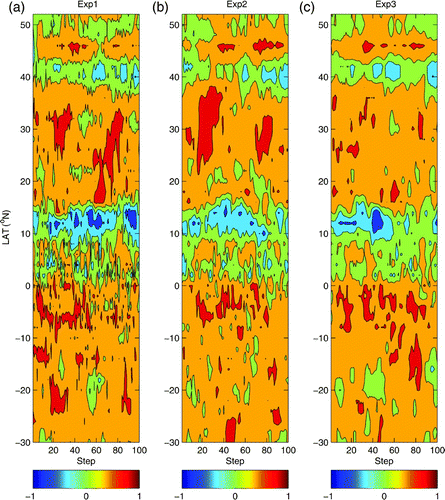
Fig. 10 Latitude-time section of the T-S correlation along 140°W for the first 100 steps. The contours are −0.8, −0.4, 0, 0.4 and 0.8.