Figures & data
Table 1. Dates, positions, MLT/ULT (average mixed layer/upper ocean temperatures within 90/200 m), MLS/ULS (average mixed layer/upper ocean salinities within 90/200 m), and SSHAs (sea surface height anomalies) for Argo floats 2900139 and 2900141.
Fig. 1 (a) The SSHA prior to Typhoon Namtheun's passage (between 17 July and 23 July). The track and the intensity of the typhoon are shown as open circles (maximum sustained wind speeds (MSW, m s−1), central pressure (hPa)). The boxes (A, B and C) represent the regions of the anticyclonic eddy, the weak cyclonic eddy and the large cyclonic eddy, respectively. The positions of the Argo floats before the passage of Namtheun are indicated by black triangles. (b) The temperature (T) and the salinity (S) profiles of Argo float 2900141 on 23 July. The surface mixed layer, the seasonal thermocline, the mode water and the permanent thermocline are separated by dotted lines. (c) The potential density (σ, kg m−3) and the Brunt-Väisälä frequency (N 2, s−2) vertical profiles. (d) The T-S diagrams.
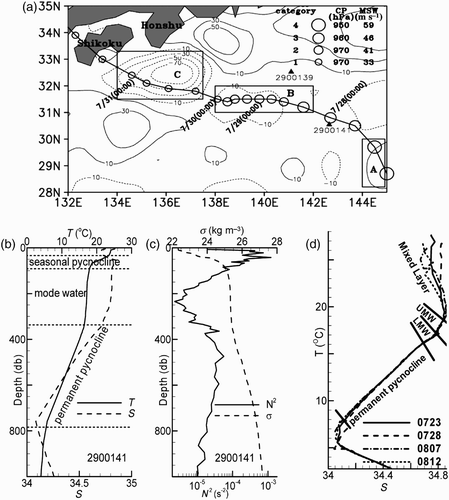
Fig. 2 The enthalpy fluxes (shaded, W m−2) and the precipitation (contour, mm d−1) for the periods (a) 07/23–07/27, (b) 07/28–08/01, (c) 08/02–08/06 and (d) 08/07–08/11.
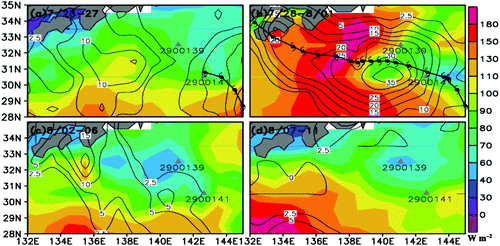
Fig. 3 The sea surface temperature (shaded, °C) and the sea surface height anomalies (contour, cm) for the periods (a) 07/24–07/26, (b) 07/27–07/28, (c) 08/01–08/03 and (d) 08/04–08/06.
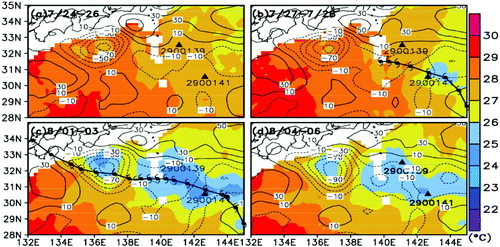
Fig. 4 The time series of (a) the sea surface pressure (SSP, solid line) and the sea surface wind (SSW, dashed line) of the typhoon, and the sea surface wind (SSW, squares) at Argo float 2900141, (b) the sea surface height anomalies at Argo float 2900141, and (c) the sea surface temperature measured by satellite and the near-surface temperature measured by Argo floats.
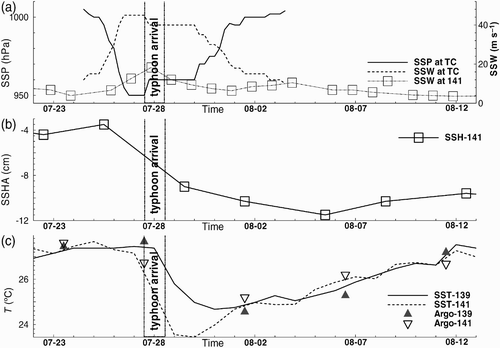
Fig. 5 The Argo (a) temperature profiles (the SSTs detected by TMI and Argo float), (b) salinity profiles, (c) density profiles, and (d) the Brunt-Väisälä frequency profiles in the upper 100 db from 23 July to 7 August.
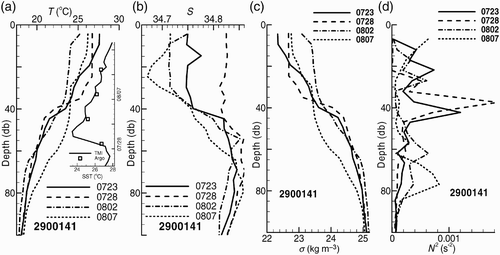
Table 2. The 5-day (e.g., ‘07/23–07/28’ represents ‘from 23 July to 28 July’) anomalies of MLH/ULH (mixed layer latent heat/upper ocean latent heat), MLF/ULF (mixed layer freshwater flux/upper ocean freshwater flux), EF/LR (enthalpy flux by OAFlux /latent heat release by precipitation) and P (precipitation according to GPCP) for Argo floats 2900139 and 2900141.
Fig. 6 (a) Temperature (T) and the salinity (S) profiles below 100 db with the arrows indicating the upwelling direction, and (b) the T-S profiles within the mode water on 28 July, 7 August and 12 August. (c) The density variation on 28 July (dσ, squares) and the Brunt-Väisälä frequency (N 2, dashed curve) profiles, and (d) the upwelling height profiles of Argo floats on 28 July, 7 August and 12 August.
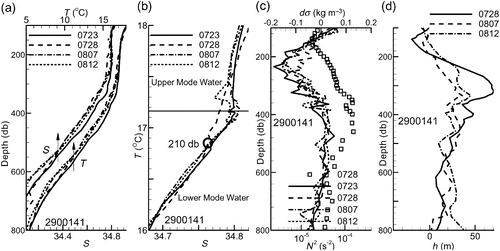
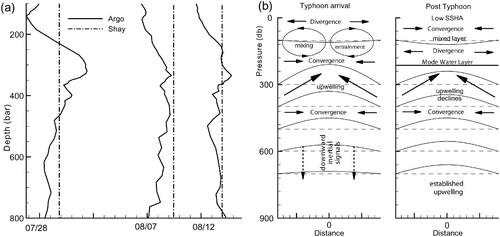
Fig. 7 (a) The upwelling height derived from density profiles (solid curve) and by Shay's formula (dashed) on 28 July, 7 August and 12 August. (b) The scheme of the ocean's responses includes typhoon passage processes and post-typhoon processes. The solid arrows indicate the convergent upwelling flow, and the dashed arrows indicate the downward propagating inertial signals.