835
Views
11
CrossRef citations to date
0
Altmetric
Original Articles

Reconstruction of Three-Dimensional Pacific Temperature with Argo and Satellite Observations

, , &
Pages 116-128 | Received 15 Mar 2011, Accepted 03 Sep 2012, Published online: 20 Nov 2012

Figures & data

Fig. 1 Annual mean temperature climatology at 10 m (left panels) and 1000 m (right panels). Panels (a1) and (b1): WOA09 data; panels (a2) and (b2): reconstructed G-Argo data; panels (a3) and (b3): the difference between G-Argo and WOA09 data.
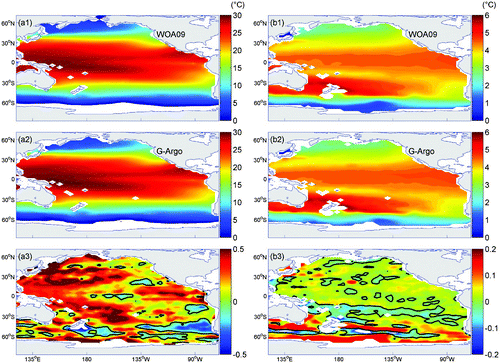
Fig. 1 Annual mean temperature climatology at 10 m (left panels) and 1000 m (right panels). Panels (a1) and (b1): WOA09 data; panels (a2) and (b2): reconstructed G-Argo data; panels (a3) and (b3): the difference between G-Argo and WOA09 data.

Fig. 2 Zonal mean annual temperature climatology of WOA09 (upper panel) and G-Argo (lower panel) in the upper 500 m. Temperature contours are 1.0°C. The difference between G-Argo and WOA09 data is shown in the lower panel as coloured shading.
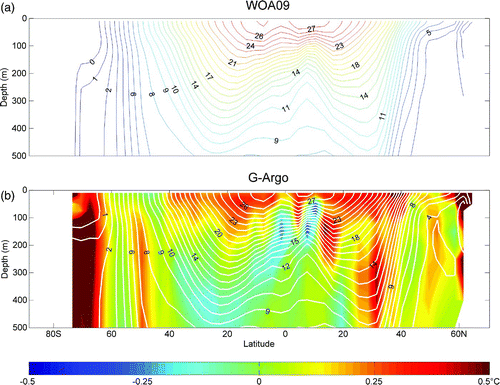
Fig. 2 Zonal mean annual temperature climatology of WOA09 (upper panel) and G-Argo (lower panel) in the upper 500 m. Temperature contours are 1.0°C. The difference between G-Argo and WOA09 data is shown in the lower panel as coloured shading.

Fig. 3 The leading EOF patterns of surface temperature in the Pacific Ocean from (a) the Ishii dataset and (b) the G-Argo product, and (c) their corresponding principal components, based on the 2000–06 period. This mode is apparently dominated by an annual cycle, accounting for 91.37% (G-Argo) and 91.98% (Ishii dataset) of the total variance.
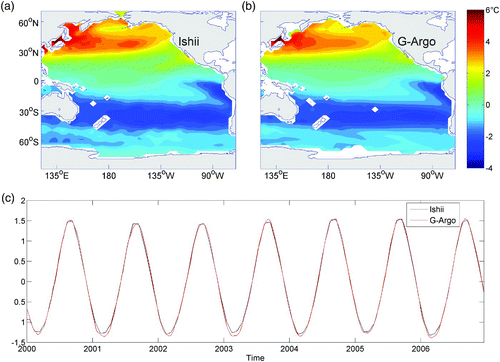
Fig. 3 The leading EOF patterns of surface temperature in the Pacific Ocean from (a) the Ishii dataset and (b) the G-Argo product, and (c) their corresponding principal components, based on the 2000–06 period. This mode is apparently dominated by an annual cycle, accounting for 91.37% (G-Argo) and 91.98% (Ishii dataset) of the total variance.

Fig. 4 As in but for the second EOF mode. This mode is apparently dominated by a semi-annual cycle, accounting for 2.89% (G-Argo) and 2.96% (Ishii dataset) of the total variance. The correlation of the corresponding PCs is 0.968.
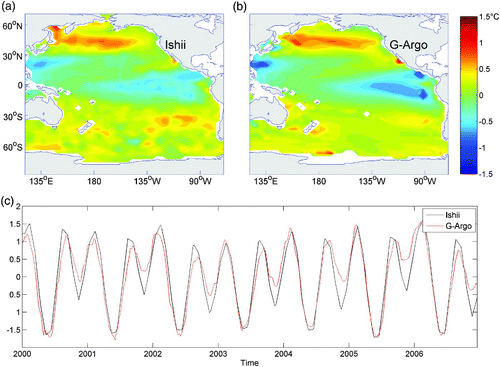
Fig. 4 As in Fig. 3 but for the second EOF mode. This mode is apparently dominated by a semi-annual cycle, accounting for 2.89% (G-Argo) and 2.96% (Ishii dataset) of the total variance. The correlation of the corresponding PCs is 0.968.

Fig. 5 Time series of temperature profiles at 147°E, 5°N for the period January 2000 to December 2010. Upper panel: TAO observations; Middle panel: reconstructed G-Argo data; Bottom panel: G-Argo minus TAO. Units are metres.
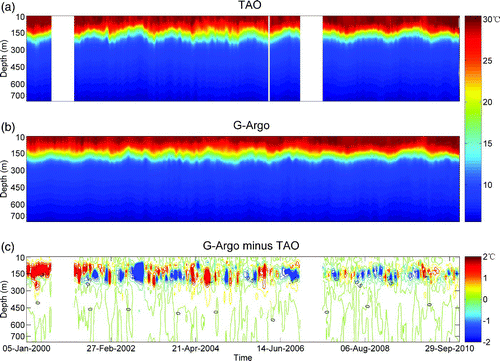
Fig. 5 Time series of temperature profiles at 147°E, 5°N for the period January 2000 to December 2010. Upper panel: TAO observations; Middle panel: reconstructed G-Argo data; Bottom panel: G-Argo minus TAO. Units are metres.

Fig. 6 The first vertical EOF modes (left panel) and their corresponding principal components (right panel) for the time series of TAO and G-Argo data at 147°E, 5°N.
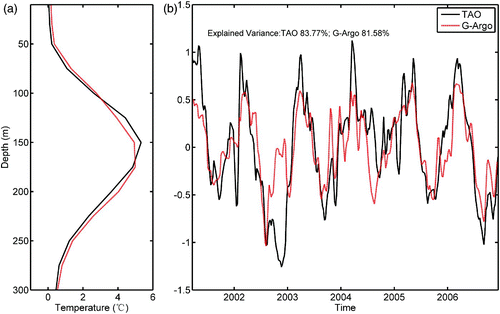
Fig. 6 The first vertical EOF modes (left panel) and their corresponding principal components (right panel) for the time series of TAO and G-Argo data at 147°E, 5°N.

Fig. 7 The G-Argo anomaly time series at 1000 m along 10.5°N for the period 2000–10.

Fig. 7 The G-Argo anomaly time series at 1000 m along 10.5°N for the period 2000–10.

Fig. 8 The leading EOF patterns of surface temperature after removing the annual cycle from (a) the G-Argo product and (b) the Ishii dataset and (c) their corresponding principal components, based on the 2000–06 period. The NINO3.4 index (dashed curve) is also plotted in (c) for comparison.
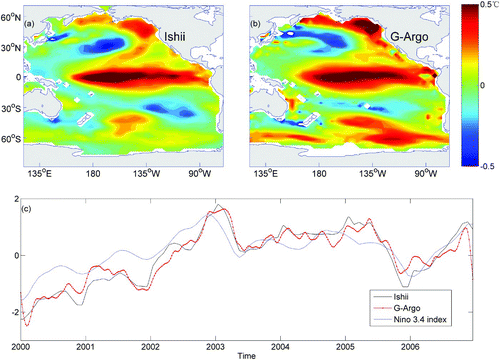
Fig. 8 The leading EOF patterns of surface temperature after removing the annual cycle from (a) the G-Argo product and (b) the Ishii dataset and (c) their corresponding principal components, based on the 2000–06 period. The NINO3.4 index (dashed curve) is also plotted in (c) for comparison.

Fig. 9 The intraseasonal variability of temperature at 147°E, 5°N for the period 3 October 2007 to 13 May 2008 from (a) TAO and (b) G-Argo.
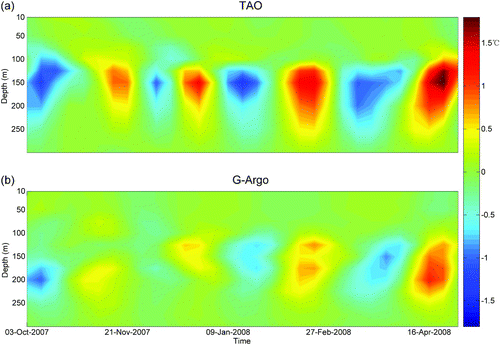
Fig. 9 The intraseasonal variability of temperature at 147°E, 5°N for the period 3 October 2007 to 13 May 2008 from (a) TAO and (b) G-Argo.

Fig. 10 The power spectra of the intraseasonal time series of TAO and G-Argo temperature at 50 m depth at 147°E, 5°N. The dashed blue line denotes the 95% confidence level.
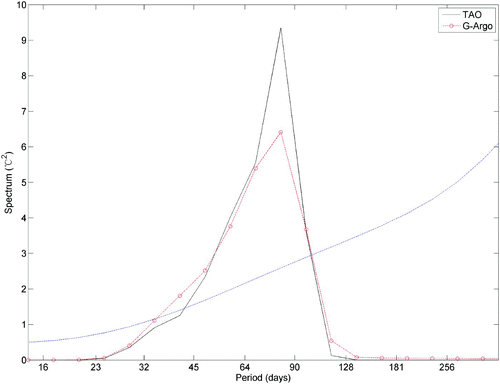
Fig. 10 The power spectra of the intraseasonal time series of TAO and G-Argo temperature at 50 m depth at 147°E, 5°N. The dashed blue line denotes the 95% confidence level.

Fig. 11 Mean absolute error in comparison with TAO observations at different depths. The solid black line denotes the optimal interpolation error alone, and the red line with circles denotes the G-Argo product error.
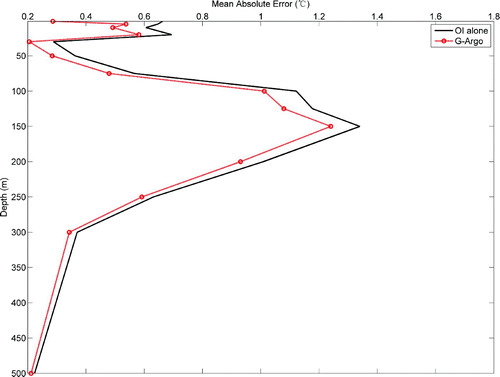
Fig. 11 Mean absolute error in comparison with TAO observations at different depths. The solid black line denotes the optimal interpolation error alone, and the red line with circles denotes the G-Argo product error.

Fig. 12 Mean absolute errors with depth of the reconstructed products derived from temperature alone (solid red line) and temperature and salinity together (solid blue line). The differences between them are shown by the dashed red line. A difference larger than zero indicates that the reconstructed product derived from temperature and salinity together is better than that from temperature alone.
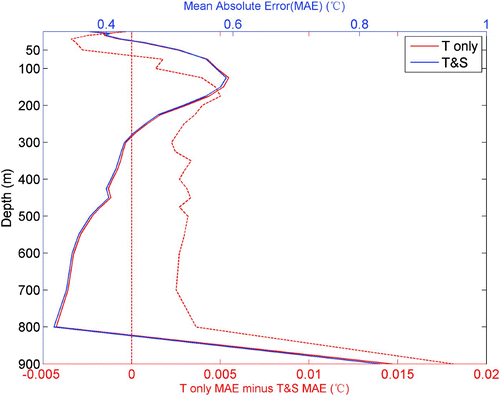
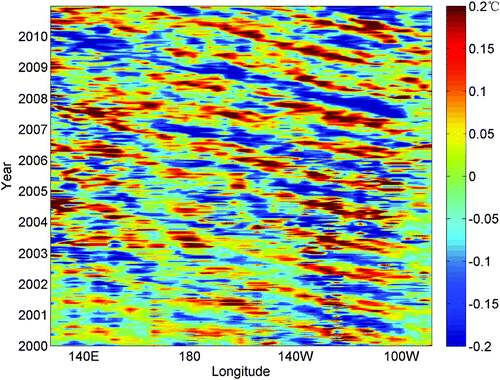
Fig. 12 Mean absolute errors with depth of the reconstructed products derived from temperature alone (solid red line) and temperature and salinity together (solid blue line). The differences between them are shown by the dashed red line. A difference larger than zero indicates that the reconstructed product derived from temperature and salinity together is better than that from temperature alone.
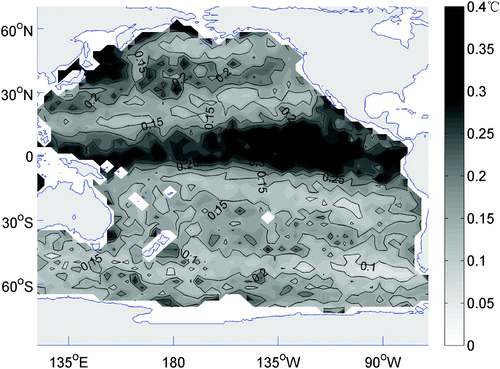
Fig. 13 Distribution of the average root-mean-square errors in all layers for the cross-validation of the MDINEOF construction in the Pacific Ocean.

Fig. 13 Distribution of the average root-mean-square errors in all layers for the cross-validation of the MDINEOF construction in the Pacific Ocean.

Reprints and Corporate Permissions

Please note: Selecting permissions does not provide access to the full text of the article, please see our help page How do I view content?

To request a reprint or corporate permissions for this article, please click on the relevant link below:

Academic Permissions

Please note: Selecting permissions does not provide access to the full text of the article, please see our help page How do I view content?

Obtain permissions instantly via Rightslink by clicking on the button below:

If you are unable to obtain permissions via Rightslink, please complete and submit this Permissions form. For more information, please visit our Permissions help page.