842
Views
3
CrossRef citations to date
0
Altmetric
Original Articles

Variation Features of the Mindanao Eddy from Argo Data

, , &
Pages 103-115 | Received 11 Mar 2011, Accepted 03 Aug 2012, Published online: 12 Nov 2012

Figures & data

Fig. 1 Schematic diagram of the current pattern between Mindanao and New Guinea (adapted from Zhou et al., Citation2010 by permission of Science China Press). Solid lines denote surface-subsurface flow (i.e., the MC, the NECC, the NGCC, the ME, and the HE). The thin dashed lines indicate flow below the subsurface–intermediate layer (i.e., Mindanao Undercurrent (MUC) and New Guinea Coastal Undercurrent (NGCUC)). The NGCC in boreal summer is shown.
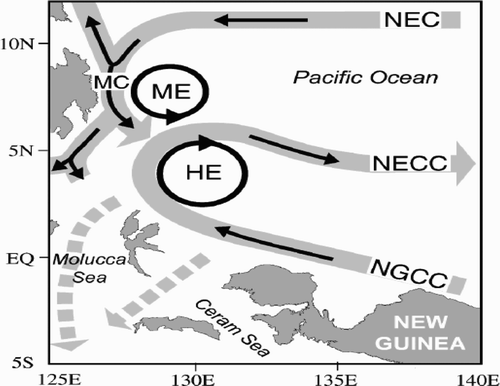
Fig. 1 Schematic diagram of the current pattern between Mindanao and New Guinea (adapted from Zhou et al., Citation2010 by permission of Science China Press). Solid lines denote surface-subsurface flow (i.e., the MC, the NECC, the NGCC, the ME, and the HE). The thin dashed lines indicate flow below the subsurface–intermediate layer (i.e., Mindanao Undercurrent (MUC) and New Guinea Coastal Undercurrent (NGCUC)). The NGCC in boreal summer is shown.

Fig. 2 Spatial distribution of Argo floats during the 2004–08 period. (There are a total of 826550 T-S profiles.).
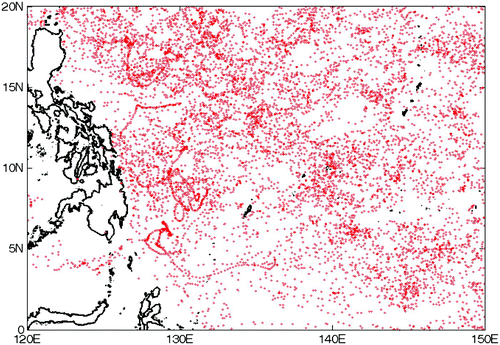
Fig. 2 Spatial distribution of Argo floats during the 2004–08 period. (There are a total of 826550 T-S profiles.).

Fig. 3 Annual mean DH distribution at 2.5 db relative to 1975 db in the tropical northwestern Pacific (units are metres).
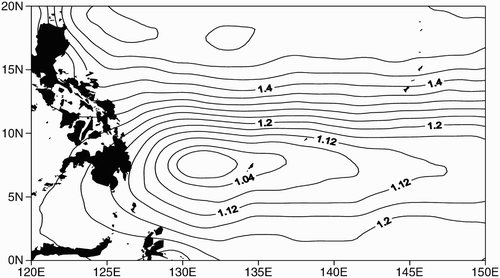
Fig. 3 Annual mean DH distribution at 2.5 db relative to 1975 db in the tropical northwestern Pacific (units are metres).

Fig. 4 Annual mean temperature distribution at different depths and sections (a) at 40 db depth, (b) at 100 db depth, (c) at 200 db depth, (d) at 600 db depth, (e) along section 132°E, and (f) along section 7.5°N.
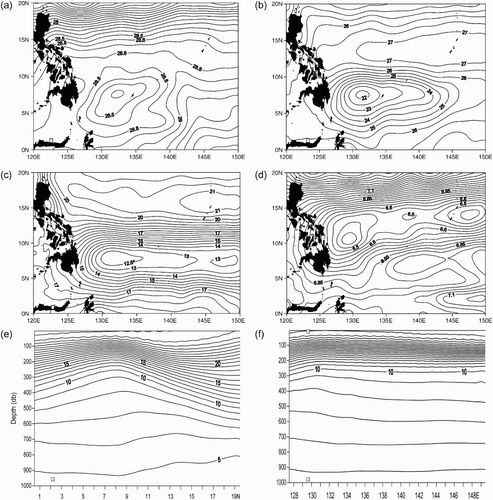
Fig. 4 Annual mean temperature distribution at different depths and sections (a) at 40 db depth, (b) at 100 db depth, (c) at 200 db depth, (d) at 600 db depth, (e) along section 132°E, and (f) along section 7.5°N.

Fig. 5 Seasonal variation in multi-year monthly averaged DH distribution at 2.5 db relative to 1975 db in (a) winter, (b) spring, (c) summer, and (d) fall.
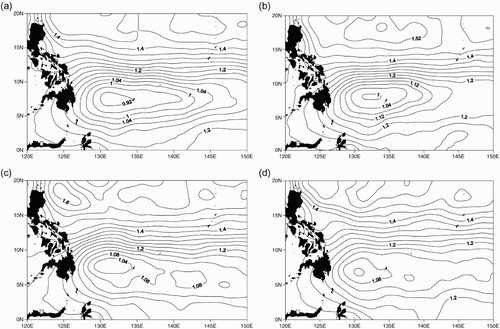
Fig. 5 Seasonal variation in multi-year monthly averaged DH distribution at 2.5 db relative to 1975 db in (a) winter, (b) spring, (c) summer, and (d) fall.

Fig. 6 Seasonal variation in the mean DH distribution at 2.5 db relative to 1975 db in the ME region.
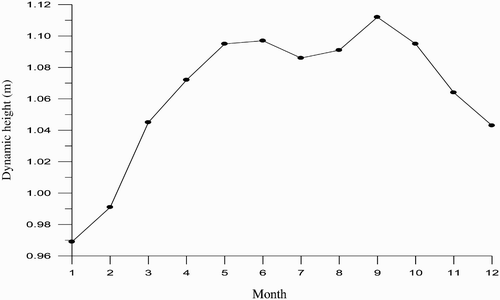
Fig. 6 Seasonal variation in the mean DH distribution at 2.5 db relative to 1975 db in the ME region.

Fig. 7 Interannual variability in the mean DH at 2.5 db relative to 1975 db in the ME region.

Fig. 7 Interannual variability in the mean DH at 2.5 db relative to 1975 db in the ME region.

Fig. 8 Interannual variability in the mean DH anomaly at 2.5 db relative to 1975 db in the ME region.
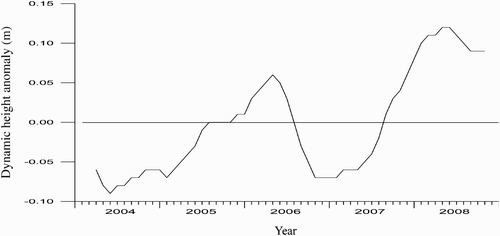
Fig. 8 Interannual variability in the mean DH anomaly at 2.5 db relative to 1975 db in the ME region.

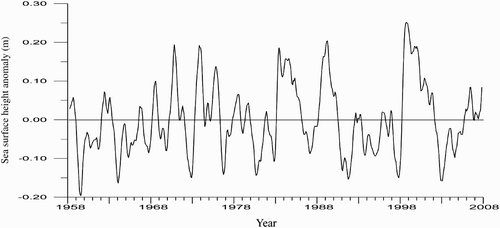
Fig. 9 Interannual variation in SSHA in the ME region.

Fig. 9 Interannual variation in SSHA in the ME region.

Fig. 10 Composite of the sea surface height anomaly in the ME region. The solid line indicates the composite El Niño event; the dashed line indicates the composite La Niña event.
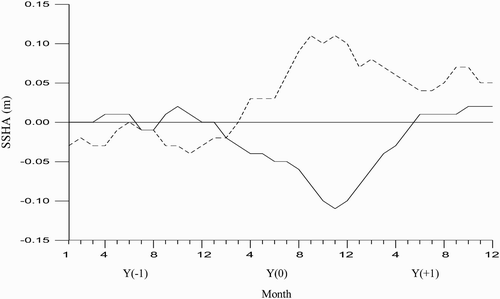
Fig. 10 Composite of the sea surface height anomaly in the ME region. The solid line indicates the composite El Niño event; the dashed line indicates the composite La Niña event.

Fig. 11 Interannual variability in the (a) NEC, (b) NECC, and (c) MC volume transport anomalies (VTA).
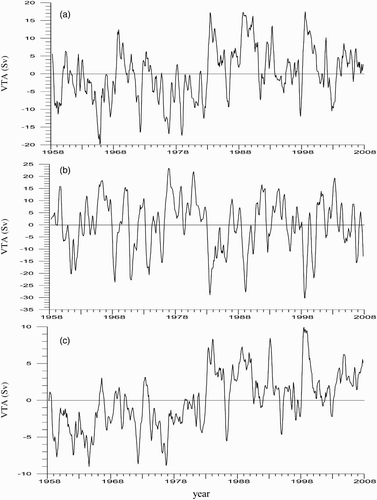
Fig. 11 Interannual variability in the (a) NEC, (b) NECC, and (c) MC volume transport anomalies (VTA).

Fig. 12 Scatter diagram for the ME centre from 2004 to 2008: 1 indicates 2004, 2 indicates 2005, 3 indicates 2006, 4 indicates 2007, and 5 indicates 2008.
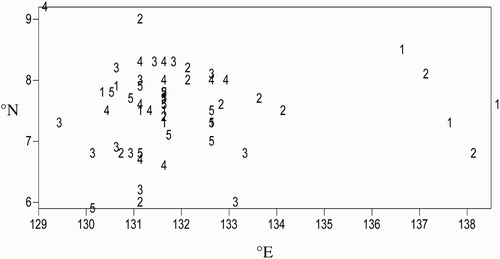
Fig. 12 Scatter diagram for the ME centre from 2004 to 2008: 1 indicates 2004, 2 indicates 2005, 3 indicates 2006, 4 indicates 2007, and 5 indicates 2008.

Fig. 13 Interannual variations in the latitudinal anomaly of the ME centre (solid line) and the interface between the NEC and the NECC (dashed line) along section 132°E.
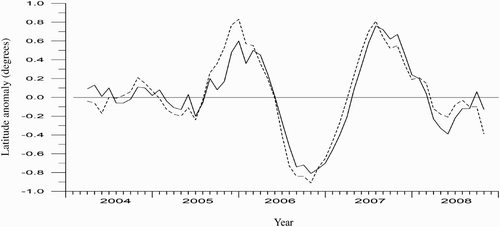
Fig. 13 Interannual variations in the latitudinal anomaly of the ME centre (solid line) and the interface between the NEC and the NECC (dashed line) along section 132°E.

Fig. 14 Interannual variation in the longitudinal anomaly of the ME centre (solid line) and the interface between MC and the northward branch of the NECC (dashed line) along section 7.5°N.
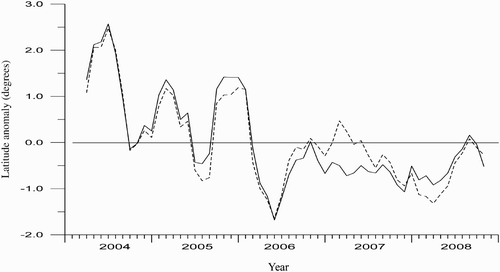
Fig. 14 Interannual variation in the longitudinal anomaly of the ME centre (solid line) and the interface between MC and the northward branch of the NECC (dashed line) along section 7.5°N.

Fig. 15 Annual mean geostrophic current velocity along section 132°E (units are cm s−1; the zero velocity surface is at 1000 db).
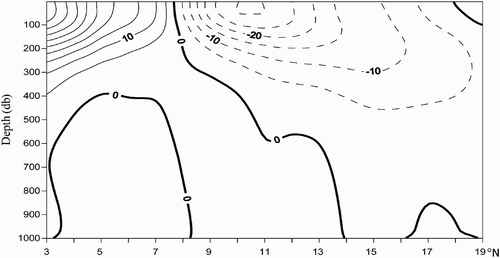
Fig. 15 Annual mean geostrophic current velocity along section 132°E (units are cm s−1; the zero velocity surface is at 1000 db).

Fig. 16 Annual mean geostrophic current velocity distribution along section 7.5°N (units are cm s−1; the zero velocity surface is at 1000 db).
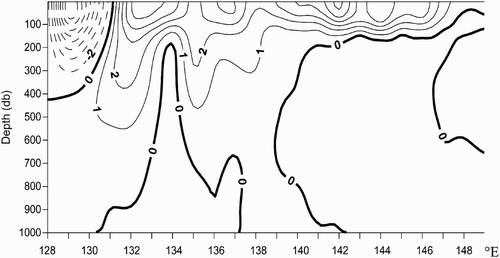
Fig. 16 Annual mean geostrophic current velocity distribution along section 7.5°N (units are cm s−1; the zero velocity surface is at 1000 db).
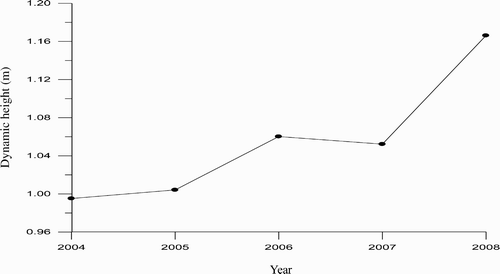
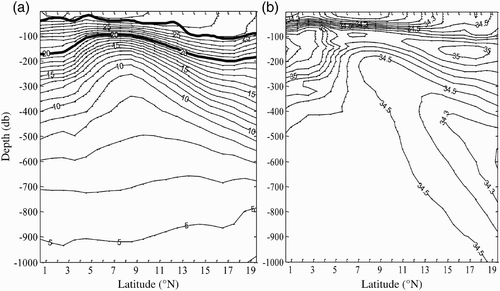
Fig. 17 Distribution of (a) temperature and (b) salinity along section 132°E in January 2005.

Fig. 17 Distribution of (a) temperature and (b) salinity along section 132°E in January 2005.

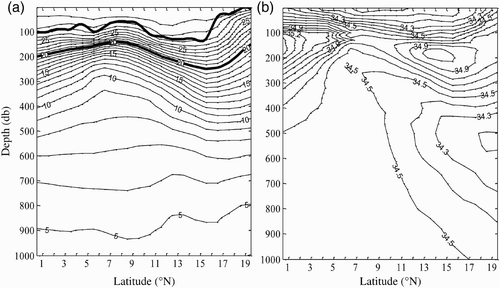
Fig. 18 Distribution of (a) temperature and (b) salinity along section 132°E in June 2008.

Fig. 18 Distribution of (a) temperature and (b) salinity along section 132°E in June 2008.

Reprints and Corporate Permissions

Please note: Selecting permissions does not provide access to the full text of the article, please see our help page How do I view content?

To request a reprint or corporate permissions for this article, please click on the relevant link below:

Academic Permissions

Please note: Selecting permissions does not provide access to the full text of the article, please see our help page How do I view content?

Obtain permissions instantly via Rightslink by clicking on the button below:

If you are unable to obtain permissions via Rightslink, please complete and submit this Permissions form. For more information, please visit our Permissions help page.