Figures & data
Table 1. Glacier area statistics for the glacierized portions of the Illecillewaet Basin. The estimated mapping error in glacier area is 3%.
Fig. 1 Map of the Illecillewaet Basin with the Illecillewaet Glacier located to the northeast and the Greeley Hydrometric station located to the southwest (green dot). Glacier polygons from Tobias Bolch, UNBC and 20 m DEM from Parks Canada.
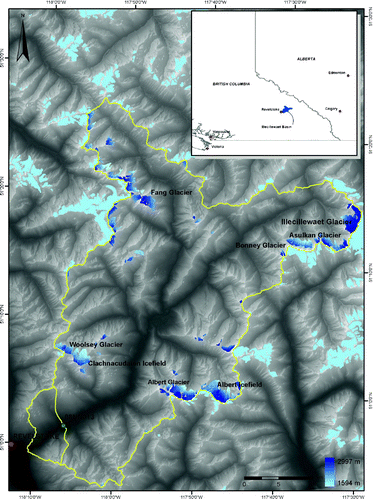
Table 2. Glacier area and elevation statistics for Illecillewaet Glacier and glaciers within the Illecillewaet River sub-basin (IRB), 2005.
Fig. 2 Percentage of glacierized area versus elevation for the Illecillewaet Glacier and in the Illecillewaet basin.
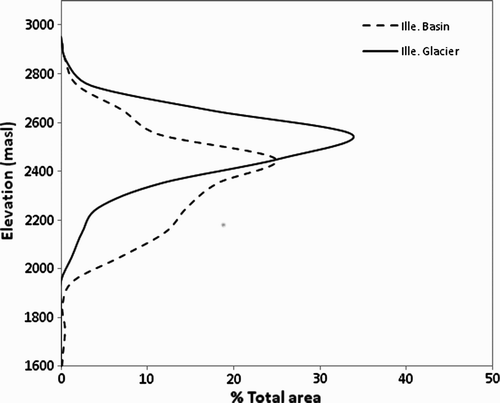
Fig. 3 Topographic contour map of the Illecillewaet Icefield study area, with an elevation contour interval of 50 m (100 m on the glaciers). The field instrumentation from summer 2009 is also indicated. AWS; automatic weathers station; RP: Rogers Pass; T and RH: temperature and relative humidity stations, respectively.
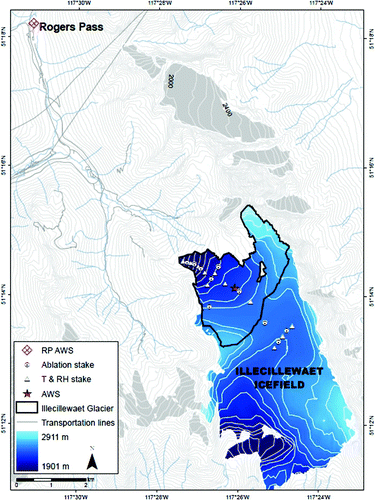
Fig. 4 Vertical profiles of Illecillewaet Glacier for winter (long dashed lines), summer (short dashed lines), and net mass balances (solid lines) for 2009 (black), 2010 (dark grey), and 2011 (light grey).
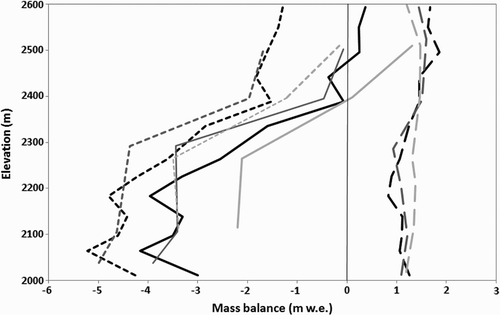
Table 3. Observed and modelled mass balance and glacier runoff, 2008 to 2011 (m w.e.) of Illecillewaet (Ille) Glacier and Illecillewaet River Basin (IRB). Uncertainty estimates are discussed in the text.
Table 4. Monthly mean weather at the Illecillewaet Glacier AWS site, summer 2009.
Table 5. Parameter values calibrated from field measurements.
Fig. 5 Hourly temperature differences between the Rogers Pass AWS and Illecillewaet Glacier AWS for all days, 1 May to 14 September 2009 (asterisks), after correcting for the mean summer temperature difference between the sites (−7.8°C). The solid line shows the average temperature difference for each hour and the dashed line shows the best-fit sine wave introduced to correct for this diurnal pattern.
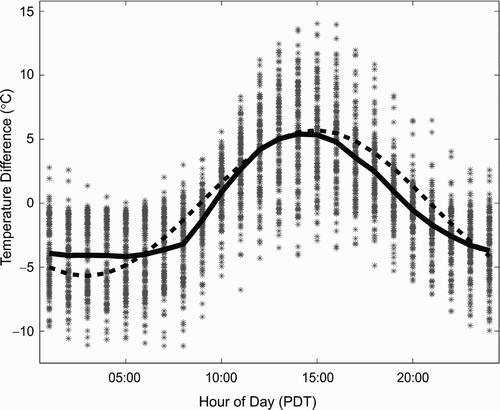
Fig. 6 Observed (solid) and modelled (dashed) daily mean albedo at the Illecillewaet Glacier AWS (2450 m elevation).
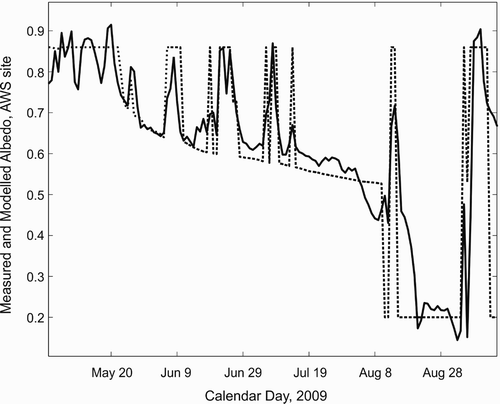
Fig. 7 Observed versus modelled melt (m w.e.) at the AWS and ablation stakes during the calibration and verification periods.
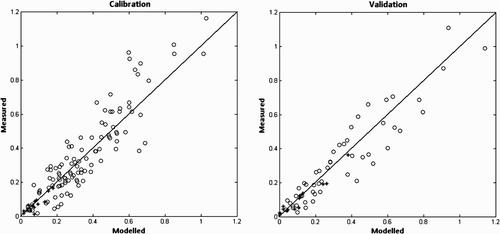
Fig. 8 Modelled (a) positive degree days (°C d), (b) melt (m w.e.), (c) potential direct solar radiation (W m−2), and (d) absorbed solar radiation (W m−2) on Illecillewaet Glacier, July 2009.
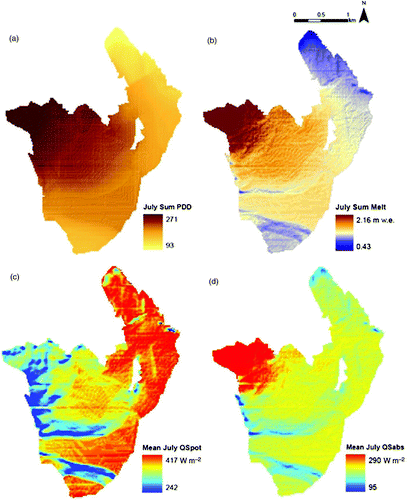
Table 6. Sensitivity of modelled Illecillewaet Glacier 2008–09 mass balance and runoff to parameter uncertainties and climatic conditions. The final column is the percentage of glacier runoff associated with ice and firn melt as opposed to seasonal snow.
Fig. 9 Sensitivity of modelled Illecillewaet Glacier runoff to perturbations in (a, c) summer temperature and (b, d) winter mass balance. (a, b). Winter (blue), summer (red), and net (black) mass balance, m w.e. (c, d). Glacier runoff (106 m3) from 1 May to 14 September for total runoff (black), snow melt (red), and ice melt (blue).
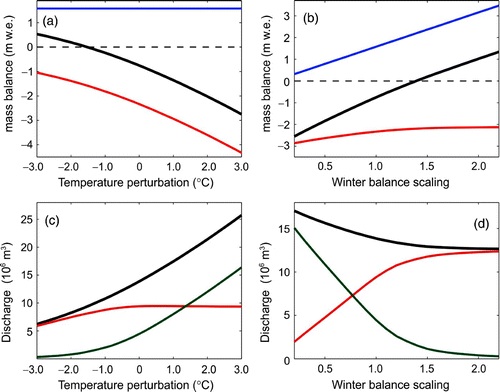
Table 7. Modelled glacier runoff, Qg , which includes meltwater from the seasonal snowpack on the glaciers, Qs , and meltwater from glacier ice and firn, Qi . IRB yield is the total basin discharge measured at the Greeley Hydrometric station for the period of study. The proportions of basin yield resulting from total glacier melt, snowmelt, and ice melt are expressed as percentages, fg , fs , and fi .
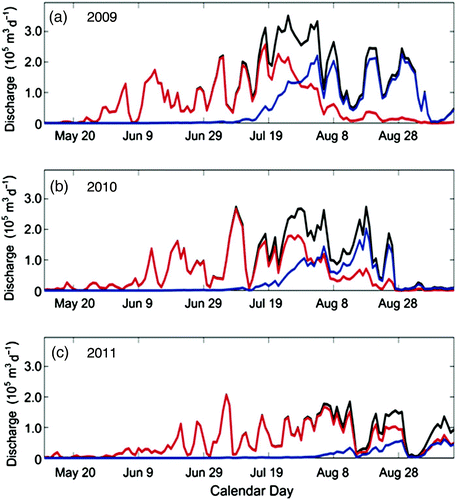
Fig. 10 Modelled glacier runoff in the IRB, 1 May to 14 September, 2009 to 2011, partitioned into snow (red), ice (blue), and total (black) runoff.