Figures & data
Fig. 1 Surroundings of the CARE sampling site (x) Google maps. Imagery@2013 TerraMetrics, Map data @ 2013 Google (June, 2013).
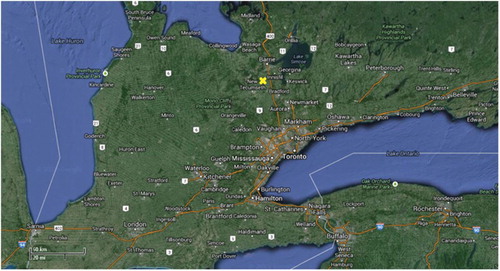
Fig. 2 Setup for VOC collection from ambient air on cartridges.
Fig. 3 Instrumental setup for IRMS analysis of ambient VOCs.
Fig. 4 Box-and-whisker plot representing statistical analysis of concentration values of aromatic VOCs at CARE measured between October 2009 and January 2010. Upper quartile (75%) and lower quartile (25%) are indicated by upper and lower ends of the boxes and medians by vertical bars within the boxes, 10% and 90% by the end points of the vertical lines.
Fig. 5 Stable carbon isotope ratios for aromatic VOCs. Upper quartile (75%) and lower quartile (25%) are indicated by upper and lower ends of the boxes and medians by vertical bars within the boxes, 10% and 90% by the end points of the vertical lines.
Fig. 6 (a) Frequency distribution of the carbon isotope ratio of benzene at CARE. The downward arrow indicates the isotope ratio of urban benzene sources (Rudolph et al., Citation2002). (b) Frequency distribution of the carbon isotope ratios of toluene at CARE. The downward arrow indicates the isotope ratio of urban toluene sources (Rudolph et al., Citation2002). (c) Frequency distribution of the carbon isotope ratios of p- and m-xylene at CARE. The downward arrow indicates the isotope ratio of urban p- and m-xylene sources (Rudolph et al., Citation2002).
Table 1. Mean photochemical ages of aromatic VOCs at CARE in fall 2009 and early winter 2010.
Fig. 7 Plot of benzene (squares) and NOx (triangles) mixing ratios versus the sum of ozone and nitrogen dioxide mixing ratios.
Fig. 8 Plot of PCA derived from benzene isotope ratios versus the sum of ozone and nitrogen dioxide mixing ratios.