Figures & data
Fig. 1 Locations of the Brewer (blue), SAOZ (grey), and ozonesonde (black) stations in Russia.
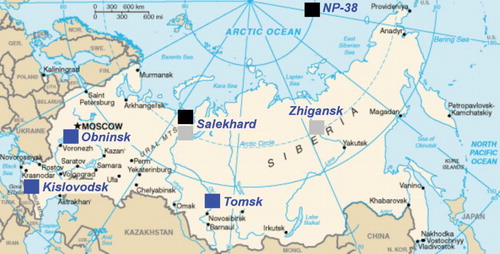
Fig. 2 Total ozone measured by (a) the Brewer MKII S/N 044 in Obninsk and (b) the Brewer MKIV S/N 049 in Tomsk from 2003 to 2012. (1 DU = 0.01 mm at standard temperature and pressure and is equivalent to 2.69 × 10²⁰ molecules per square metre.)
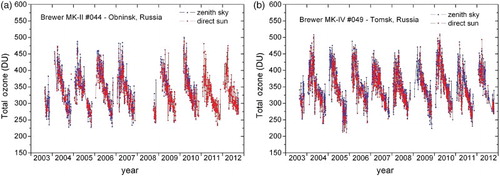
Fig. 3 Total ozone measured by (a) the Brewer MKII S/N 044 in Obninsk and (b) the Brewer MKIV S/N 049 in Tomsk in 2011. A dip can be observed in the Tomsk data in early April 2011 when the ozone-depleted vortex moved towards central Siberia. The initial plots of the total ozone deviation are from EC (Citation2013). The green line shows the monthly averaged mean values of total ozone in Obninsk and Tomsk in 2011. The blue dotted lines show ±2 sigma standard deviation from the climatic mean. The black ovals show the time period of unusually low total ozone in Obninsk and Tomsk in spring 2011.
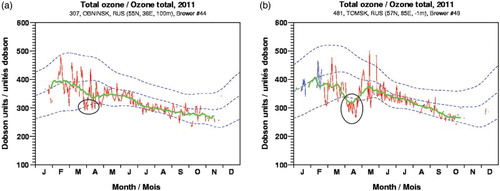
Fig. 4 Total ozone and NO2 at (a) Zhigansk station from 1991 to 2011 and (b) Salekhard station from 2001 to 2011. The blue curve shows the measurements taken at sunrise and the red curve those taken at sunset.
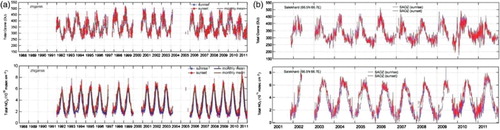
Fig. 5 WOUDC total ozone mapping on 23 and 31 March 2011 when the low ozone vortex passed over (a) Zhigansk and (b) Salekhard. The initial plots of the total ozone deviation are from EC (2013).
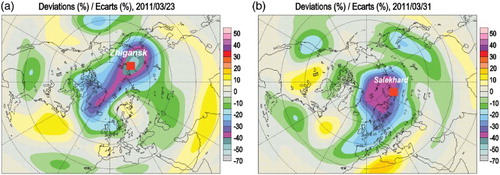
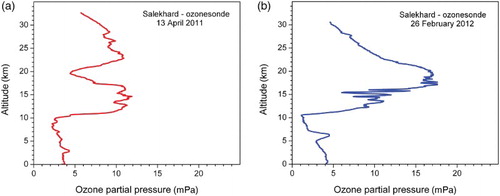
Fig. 6 Ozone profiles from 2Z-ECC sonde launched at Salekhard in the polar vortex in (a) April 2011 and (b) February 2012.