Figures & data
Fig. 1 The spectrum of the BP ozone absorption cross-sections at −45°C (left axis, red line). The ratio (right axis) of the S13 (green line) and BDM (blue line) cross-sections to the BP cross-sections at a temperature of −45°C. The blue crosses on the figure indicate the operating wavelengths of B005.
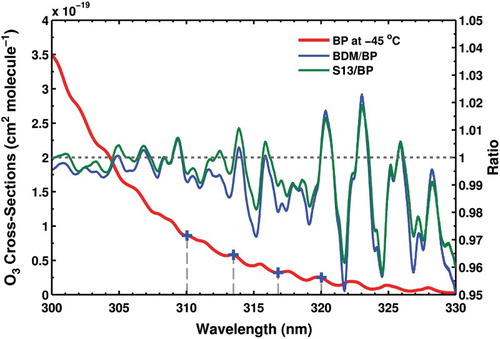
Fig. 2 Calculated effective temperature for ozone absorption over Thessaloniki for the period 2000–10. The dashed black line indicates the −45°C temperature used in the standard Brewer ozone retrieval algorithm and the green line the mean temperature, −49.36°C, for the period. The red line shows the trend of the ozone effective temperature.
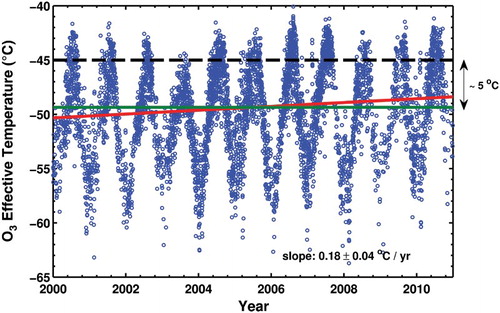
Fig. 3 Temperature sensitivity of the differential ozone absorption coefficient for B005 for the ozone effective temperature range over Thessaloniki derived for BP (blue), BDM (green), and S13 (red). The filled circles correspond to the gradient at −45°C calculated for each cross-section dataset.
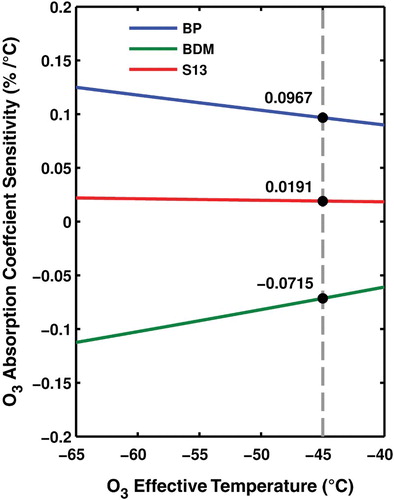
Table 1. Temperature dependence of the differential ozone absorption coefficient calculated for three different ozone cross-sections in different studies, using the nominal Brewer weighting coefficients.
Fig. 4 Expected error in the TOC measured at Thessaloniki because of the deviation of the ozone effective temperature from −45°C.
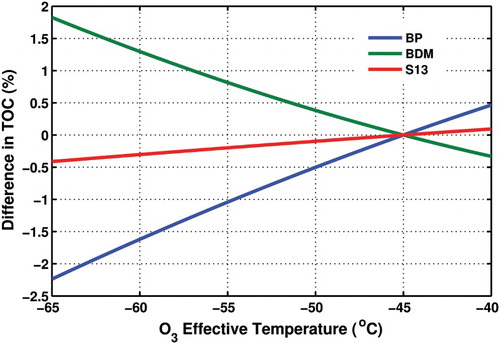
Fig. 5 Seasonal variation of the expected error in the TOC measured at Thessaloniki because of the deviation of the ozone effective temperature from −45°C for (a) BP, (b) BDM, and (c) S13. The blue line is the mean seasonal error for the period 2000–10, and the shaded envelope corresponds to ±1σ of the daily deviations. The absolute range of the y-axis is the same for all graphs, at 2.5%, in order to enable direct comparison of the TOC errors derived from the three sets of cross-sections.
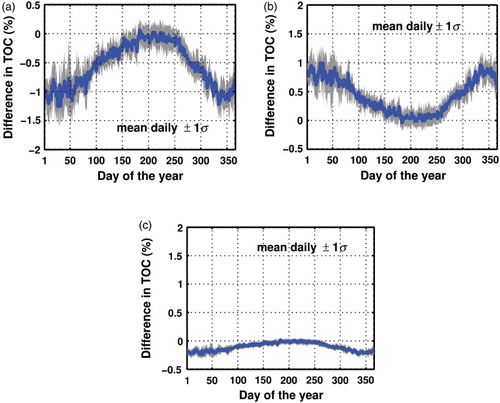
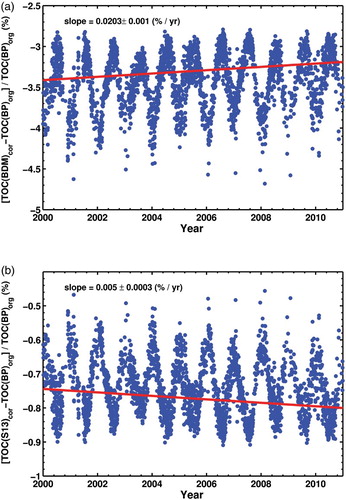
Fig. 6 Percentage difference between the original TOC series calculated using the BP spectra and the post-corrected for the temperature dependence of ozone cross-sections for the BP spectra. The red line shows a linear fit to the data.
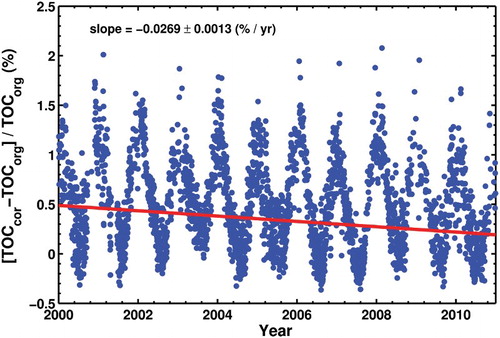
Fig. 7 Percentage difference between the original TOC series calculated using the BP spectra and the post-corrected series for the temperature dependence of ozone cross-sections for (a) BDM and (b) S13. Note the different scales of the y-axes in the two panels.