775
Views
14
CrossRef citations to date
0
Altmetric
Fundamental Research / Recherche fondamentale

Intercomparison of Oceansat-2 and ASCAT Winds with In Situ Buoy Observations and Short-Term Numerical Forecasts

, , &
Pages 92-102 | Received 25 Jun 2012, Accepted 15 Oct 2013, Published online: 10 Jan 2014

Figures & data

Fig. 1 Buoy locations.

Fig. 1 Buoy locations.

Table 1. Statistical parameters for OSCAT and ASCAT wind speeds during the 2011 monsoon over the northern band and the tropics (ws (scat) is the monthly mean scatterometer wind speed; ws (buoy) is the monthly mean buoy wind speed; and NC is the number of collocated scatterometer winds).

Table 2. Statistical parameters for OSCAT and ASCAT wind directions during the 2011 monsoon over the northern band and the tropics (wd (scat) is the monthly mean scatterometer wind direction; wd (buoy) is the monthly mean buoy wind direction; and NC is the number of collocated scatterometer winds).

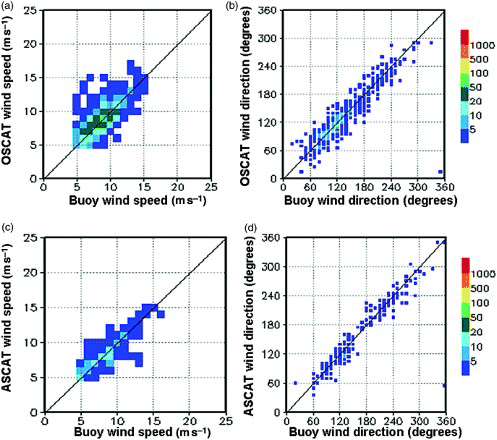
Fig. 2 Density plot for scatterometer winds with respect to buoy winds: (a) OSCAT wind speed, (b) OSCAT wind direction, (c) ASCAT wind speed, and (d) ASCAT wind direction for July 2011 over the northern band (the colour bar indicates the number of collocated scatterometer winds).
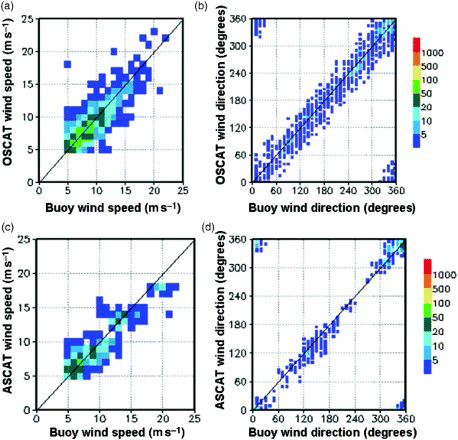
Fig. 2 Density plot for scatterometer winds with respect to buoy winds: (a) OSCAT wind speed, (b) OSCAT wind direction, (c) ASCAT wind speed, and (d) ASCAT wind direction for July 2011 over the northern band (the colour bar indicates the number of collocated scatterometer winds).

Fig. 3 As in , but over the tropics.

Fig. 3 As in Fig. 2, but over the tropics.

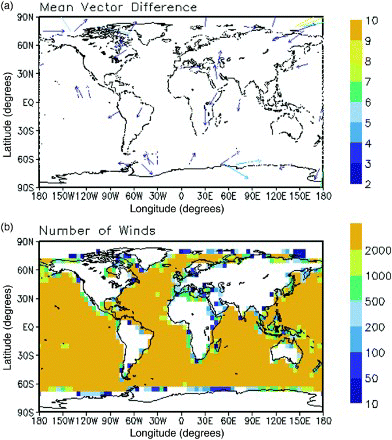
Fig. 4 Vector plot of OSCAT winds: (a) mean vector difference (the colour bar indicates the magnitude of the vector difference and (b) number of collocations (the colour bar indicates the number of collocated scatterometer winds) for July 2011.
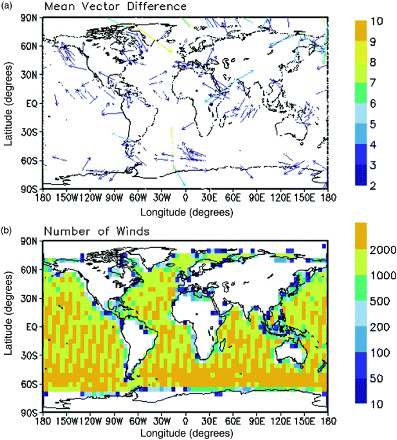
Fig. 4 Vector plot of OSCAT winds: (a) mean vector difference (the colour bar indicates the magnitude of the vector difference and (b) number of collocations (the colour bar indicates the number of collocated scatterometer winds) for July 2011.

Fig. 5 As in , but for ASCAT winds.

Fig. 5 As in Fig. 4, but for ASCAT winds.

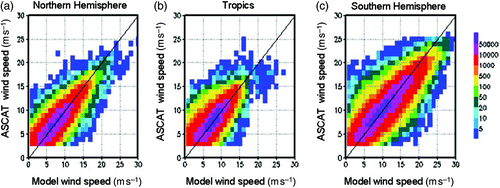
Fig. 6 Density plot for OSCAT winds with respect to model background winds over (a) the northern band (20°–90°N), (b) the tropics (20°N–20°S), and (c) the southern band (20°–90°S) for July 2011 (the colour bar indicates the number of collocated scatterometer winds).
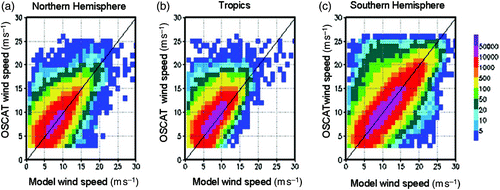
Fig. 6 Density plot for OSCAT winds with respect to model background winds over (a) the northern band (20°–90°N), (b) the tropics (20°N–20°S), and (c) the southern band (20°–90°S) for July 2011 (the colour bar indicates the number of collocated scatterometer winds).
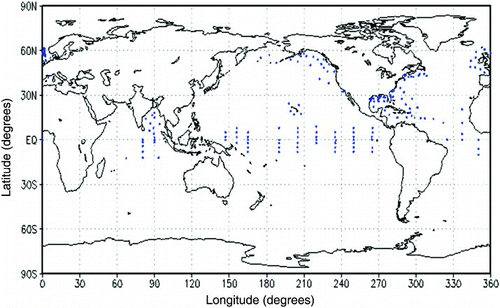
Fig. 7 As in , but for ASCAT winds.

Fig. 7 As in Fig. 6, but for ASCAT winds.

Table 3. Statistical parameters of wind speed, wind direction, zonal wind, and meridional wind for OSCAT and ASCAT with respect to NCMRWF model 6 h forecast during the 2011 monsoon over the northern latitudinal band.

Table 4. As in but over the tropics.

Table 5. As in , but over the southern latitudinal band.

Table 6. Statistical parameters for triple collocations of OSCAT, ASCAT, and modelled 6 h forecast winds. NC is the number of triple-collocated point.

Reprints and Corporate Permissions

Please note: Selecting permissions does not provide access to the full text of the article, please see our help page How do I view content?

To request a reprint or corporate permissions for this article, please click on the relevant link below:

Academic Permissions

Please note: Selecting permissions does not provide access to the full text of the article, please see our help page How do I view content?

Obtain permissions instantly via Rightslink by clicking on the button below:

If you are unable to obtain permissions via Rightslink, please complete and submit this Permissions form. For more information, please visit our Permissions help page.