Figures & data
Fig. 1 Slit functions measured with an HeCd-laser for the single Brewer #037 and a double Brewer #107 at Izaña 2011. For Brewer #107 there are some spikes in the wing caused by internal reflections. On average, for Brewer #037 the relative intensity outside the triangular core is about two orders of magnitude higher than the relative intensity for Brewer #107.
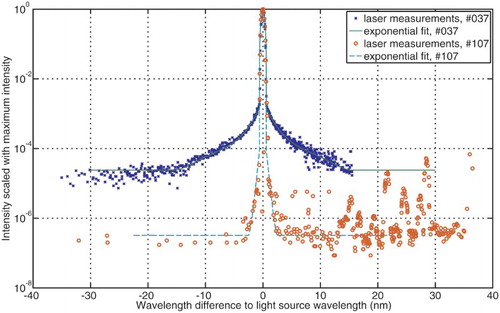
Table 1. Slit function fits for Brewers #037 and #107. Fits have been divided into three parts: a triangular core with FWHM 0.6 nm, an exponentially decaying wing, and a flat outer region.
Fig. 2 Brewer #037 direct response constructed by modelling the Brewer DS measurements.
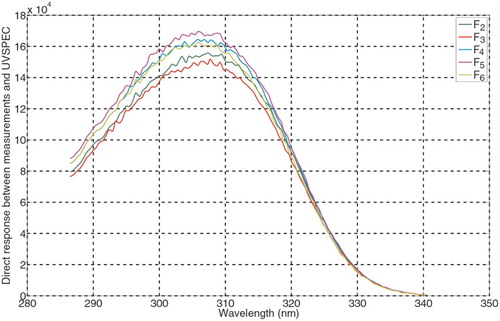
Fig. 3 Calibration plots for the modelled ideal Brewer and Brewer #037.
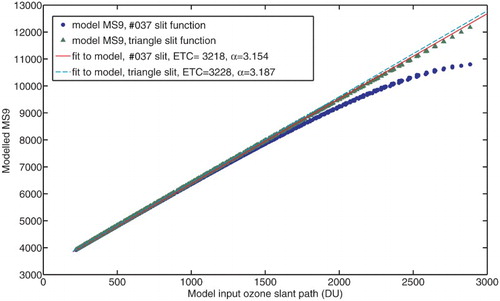
Fig. 4 Ratios, an, of modelled count rates of ozone retrieval wavelengths between Brewers with an ideal slit function (triangle, FWHM 0.6 nm) and with the Brewer #037 slit.
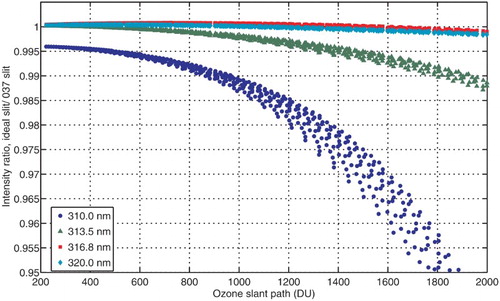
Fig. 5 Additive correction β calculated from every simulated DS measurement using Eq. (7). To be used as a correction with real data, a representative fit has been made as a function of the single Brewer ozone slant column.
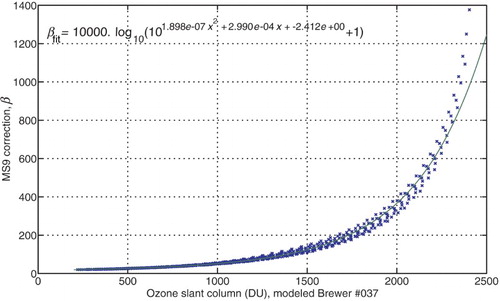
Fig. 6 Brewer #037 ETC and absorption coefficients fitted for original and stray-light corrected data to match Brewer #157 at low air mass values.
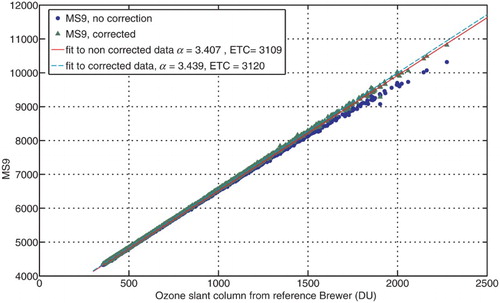
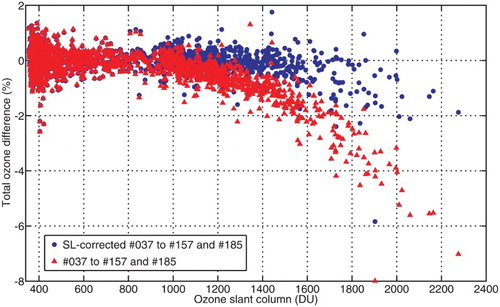
Fig. 7 Relative difference between Brewer #037 total ozone columns and Brewer #185/#157 total ozone columns before and after stray-light correction.