Figures & data
Table 1. OCS retrieved total column uncertainties.
Fig. 1 Average OCS total column and volume mixing ratio (vmr) with error bars (1 standard deviation σ) above Paris measured by FTIR from March 2011 to March 2012. The grey dashed lines represent the annual weighted averages (the weight of each measurement is relative to its standard deviation).
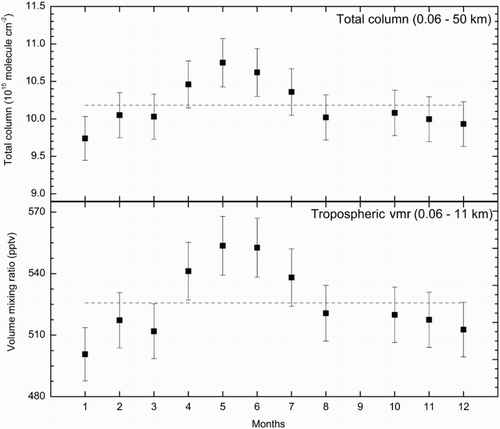
Table 2. Monthly averaged OCS total column and volume mixing ratio, with their errors, above Paris measured by the QualAir FTS (described in Section 2a) from March 2011 to March 2012.
Fig. 2 Pressure-corrected total column of OCS with error bars (standard deviation) versus latitude (°N). The ground-based (NDACC and other) and balloon-borne measurements from the Bruker IFS125HR interferometer, the MkIV instrument (orange, Toon, Citation1991) and the QualAir FTS instrument (red) are the weighted averages of several years with the minimum and maximum of each range shown by crosses and dashed lines. The other measurements are from Polarstern cruise campaigns measured by a Bruker 120M interferometer (Notholt et al., Citation2000; Xu, Bingemer, Georgii, Schmidt, & Bartell, Citation2001) and from the SWIR-balloon instrument from the Esrange balloon campaign (red, Té et al., Citation2002).
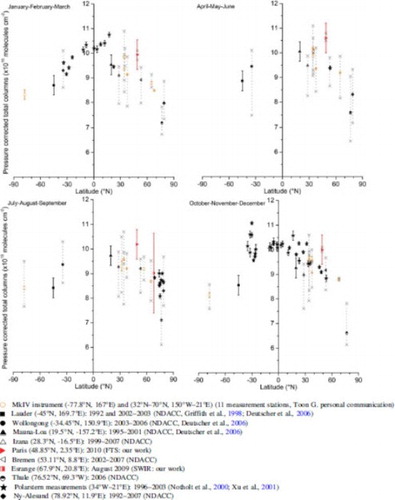
Fig. 3 OCS partial column above 13 km with error bars (representing the 1σ measurement precisions) versus latitude (°N) from several MkIV campaigns (STRAT, POLARIS, SOLVE I and II, and AASE II) (Toon, Citation1991; Toon, Blavier, Solario, & Szeto, Citation1993), aircraft P-AVE campaigns measured by the FTIR instrument (Coffey & Hannigan, Citation2010), and from the StraPolÉté balloon campaign measured by the SWIR instrument (dark cyan; Té et al., Citation2002). The values in blue (blue and dark cyan) are for campaigns occurring during June, July, and August and in black for campaigns occurring during January, February, and March.
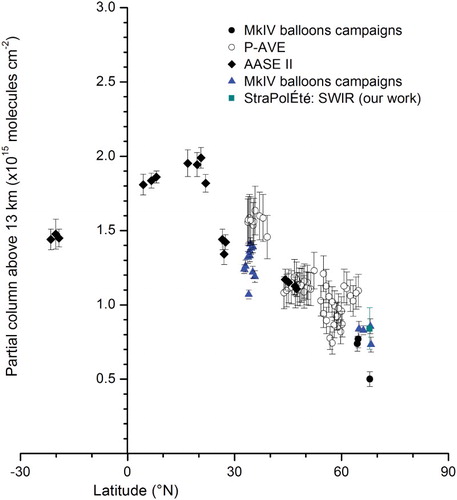
Fig. 4 SPIRALE measurements of OCS volume mixing ratios (in ppt) with error bars on 9 June 2008 (filled blue circles) above Teresina, Brazil (5.1°S, 42.9°W) on 24 August 2009 (open red circles) and 20 April 2011 (filled black circles) above Esrange, Sweden (67.9°N, 21.1°E). The thermal tropopause (Tp) and the tropical tropopause layer (TTL) top and bottom are represented by a solid blue line and by blue dashed lines, respectively, for the flight at tropical latitudes on June 2008.
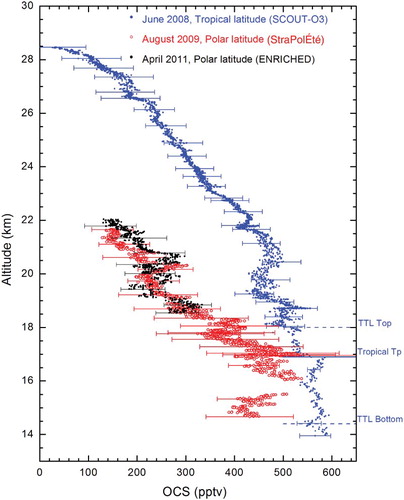
Fig. 5 Left panels: SPIRALE measurements of OCS volume mixing ratios (in pptv) with error bars (red triangles) compared with the weighted average (weight of each measurement relative to its 1σ error) of the ACE-FTS OCS profiles with error bars (1σ) (black squares). The grey dashed lines represent the spread (minimum and maximum values found in all ACE profiles). Right panels: Percentage differences between the SPIRALE and ACE-FTS data with error bars. The vertical red line is drawn only to mark a zero difference. Top panels: Comparisons for the SPIRALE flight on 9 June 2008 at Teresina, Brazil. Bottom panels: Comparisons for the SPIRALE flight on 24 August 2009 at Esrange, Sweden.
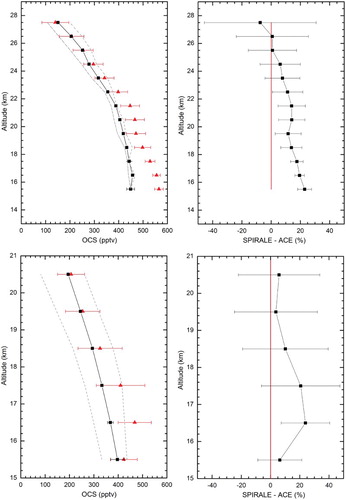
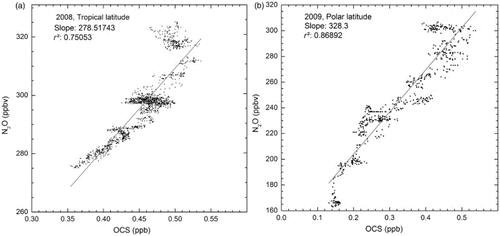
Fig. 6 Correlation between N2O and OCS from SPIRALE volume mixing ratio in situ measurements in the lower stratosphere (below 22 km): (a) 9 June 2008 above Teresina, Brazil (5.1°S, 42.9°W) and (b) 24 August 2009 above Esrange, Sweden (67.9°N, 21.1°E).