Figures & data
Fig. 1 Latitude-altitude cross-section of mean zonal mean ozone (mg kg−1) from the dataset of Fortuin and Kelder (Citation1998) for (a) January and (b) July, as part of the standard mean seasonal ozone cycle used in ECHAM5.
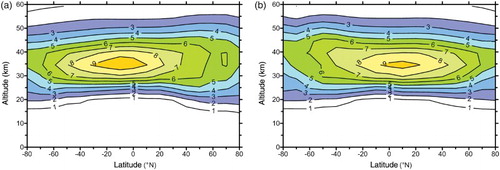
Fig. 2 Hovmöller diagram of zonal ozone anomaly (mg kg−1) at 20 hPa derived from ERA-40 reanalysis data for 1960 to 1999. For winter (DJF), monthly mean ozone values are averaged latitudinally from 45° to 75°N. Variability shorter than three years is removed using low-pass filtering.
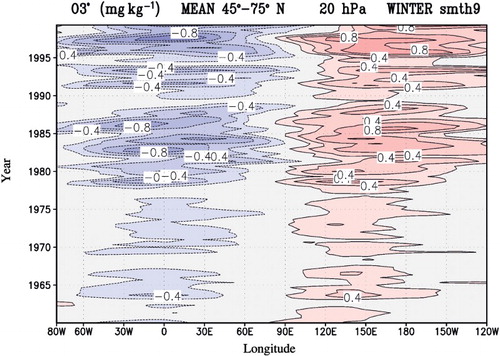
Fig. 3 Stereographic projection of mean zonal ozone anomaly (mg kg−1) at 20 hPa derived from ERA-40 reanalysis data for winter (DJF) averaged over (a) the 1960–69 period and (b) the 1990–99 period.
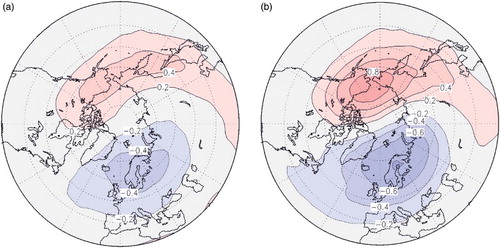
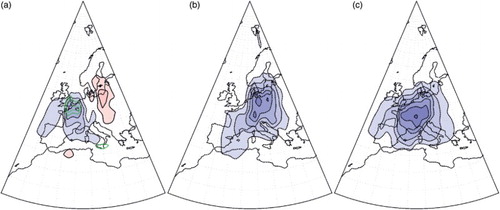
Fig. 4 Altitude-longitude cross-section of (a) and (d) mean GH difference (DGH (m) = O3ZOA minus O3ZMO), (b) and (e) mean geopotential height (GH (m)) for O3ZMO, and (c) and (f) mean geopotential height (GH (m)) for O3ZOA at 65°N for January 1980–99 (top row) and for January 1960–79 (bottom row). Areas at the 95% significance level based on a Student's t-test are enclosed by green lines ((a) and (d) only).
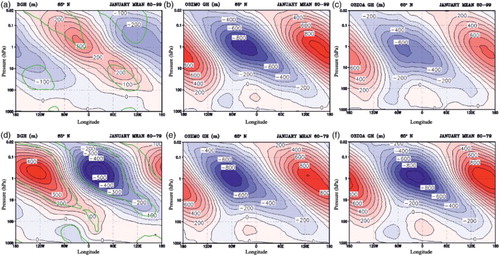
Fig. 5 Altitude-longitude cross-section of mean geopotential height difference (DGH (m) = O3ZOA minus O3ZMO) at 65°N for (a) October, (b) November, and (c) December. Areas at the 95% significance level based on a Student's t-test are enclosed by green lines. These plots correspond to a for January.
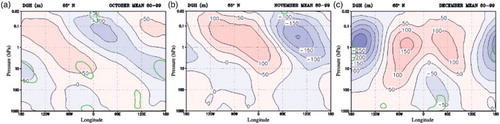
Fig. 6 Occurrence rate of major SSW events for experiments O3ZMO and O3ZOA during the 1980–99 period with stronger zonal ozone anomalies. The overall increase in SSW events (sum for the 1980s and 1990s) in run O3ZOA is significant at the 94% confidence level.
Fig. 7 Mean seasonal cycle of NAM variance (low-pass filtered; interannual variance) for runs (a) O3ZMO and (b) O3ZOA during the 1980–99 period. The thick and thin green lines in (b) enclose areas of variance change significant at the 90% and 95% confidence levels, respectively.
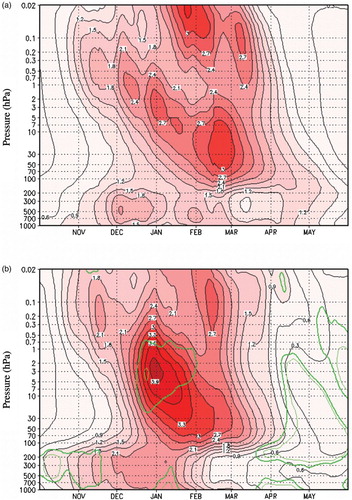
Fig. 8 NAM diagnosis for the ERA-Interim reanalysis dataset from 1979 to 2011. (a) Mean seasonal cycle of NAM variance (low-pass filtered; interannual variance). (b) Predictive skill as a percentage variance based on daily NAM values. The monthly mean AO was predicted with a lead time of 10 days, and a Gaussian weighting with an FWHM of 60 days was applied. The shaded area indicates a significant difference from zero at the 95% confidence level.
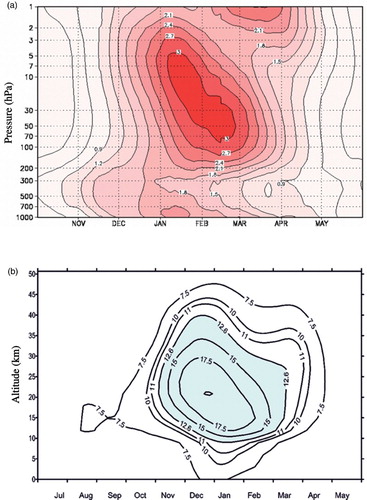
Fig. 9 Predictive skill as a percentage variance based on daily NAM values of ECHAM5 runs (a) O3ZMO and (b) O3ZOA from 1960 to 1999. The monthly mean AO is predicted with a lead time of 10 days, and a Gaussian weighting with an FWHM of 60 days was applied. The shaded area indicates a significant difference from zero at the 95% confidence level.
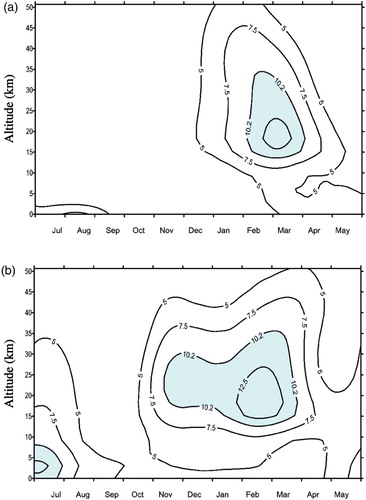
Fig. 10 Mean winter AO evolution for experiments O3ZMO (blue line) and O3ZOA (red line) and for ERA-Interim reanalysis data (black line) smoothed with a 7-year running mean.
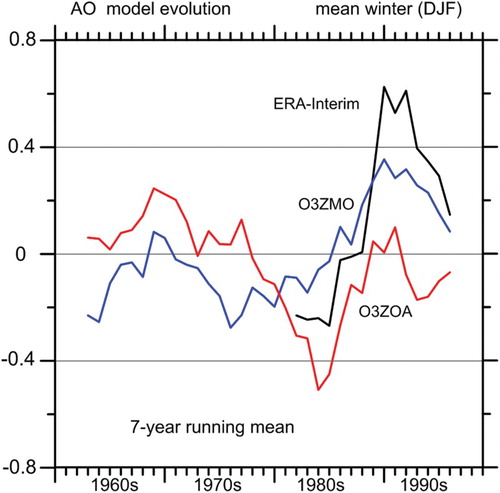
Fig. 11 (a) Stereographic projection of the difference between the regressed geopotential height with the time series of negative AO (GHD (m) = O3ZOA minus O3ZMO) at 1000 hPa showing the weakening of the AO pattern due to the zonal ozone anomaly. Reconstructed extreme GH (km) for (b) mean GH minus 2 times regressed AO for O3ZMO, and (c) for mean GH plus 2 times regressed AO for O3ZOA at 300 hPa showing more upper tropospheric diffluence over the North Atlantic–European region in Fig.11c.
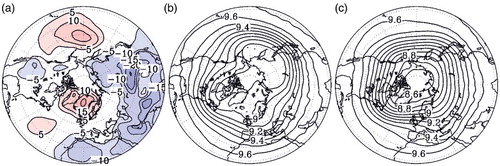
Fig. 12 Mean distribution of poleward RWB events (called P2-RWB, m2 s−2 d−1) calculated for experiments (b) O3ZMO, (c) O3ZOA and (a) their difference for winter (DJF) from 1979 to 1998. The thick and thin green lines in (a) indicate a significant difference from zero at the 90% and 95% confidence levels, respectively, using a Student's t-test.