Figures & data
Table 1. Stations with long time series of accessible UV data analyzed in this study. Stations are listed from northern to southern high latitudes.
Fig. 1 Changes in total ozone over (a) 55°–70°N and (b) 55°–70°S. Long-term changes are given as a percentage per decade.
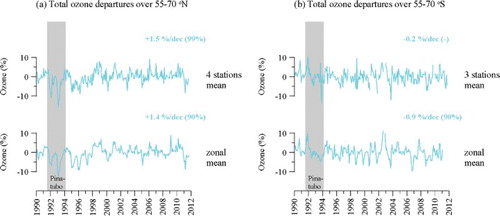
Fig. 2 Changes in AOD at 550 nm over (a) 55°–70°N and (b) 55°–70°S. For the overlapping period 2000–2006, the zonal mean AODs are 0.21 (GACP) and 0.14 (MODIS) for northern high latitudes; 0.20 (GACP) and 0.13 (MODIS) for southern high latitudes.
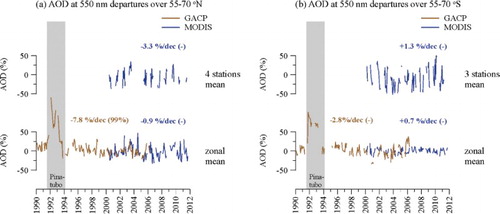
Fig. 3 Changes in cloud fraction over (a) 55°–70°N and (b) 55°–70°S. For the overlapping period 2000–2006, the stations mean cloud fractions are 0.65 (ISCCP) and 0.70 (MODIS) for northern high latitudes; 0.74 (ISCCP) and 0.79 (MODIS) for southern high latitudes.
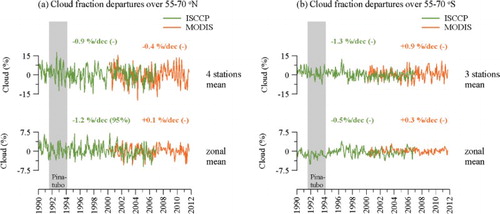
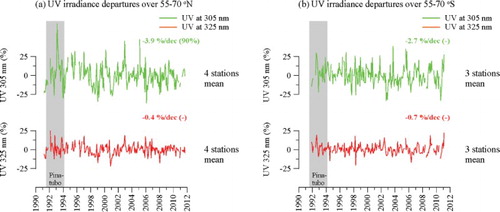
Fig. 4 Changes in UV irradiances at 305 and 325 nm averaged over (a) four stations located between 55° and 70°N and (b) three stations located between 55° and 70°S.