Figures & data
Table 1. Description of stations included in the analysis.
Table 2. Specifications of measuring instruments. The rise/fall time indicates the time needed to measure 95% of the desired ozone concentration value.
Fig. 1 Time series of average monthly surface ozone concentration for 2005–2010.
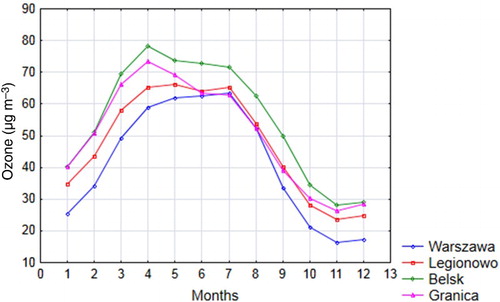
Fig. 2 Time series of average diurnal surface ozone concentration for July 2005–2010.
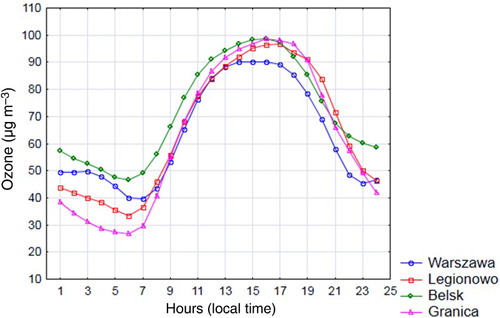
Fig. 3 Time series of average diurnal surface ozone concentration for January 2005–2010.
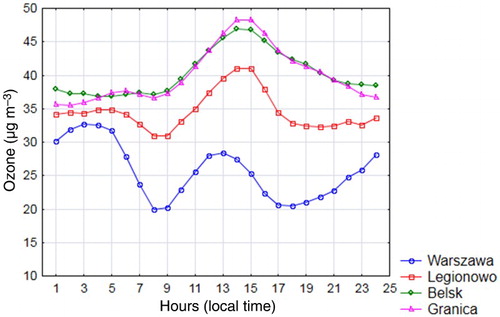
Fig. 4 Frequency distribution of surface ozone concentration for the 2005–2010 time series.
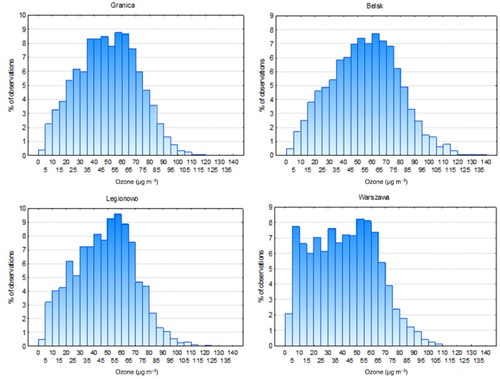
Fig. 5 Number of days when ozone concentrations exceeds 120 µg m−3 per 8 h in a year.
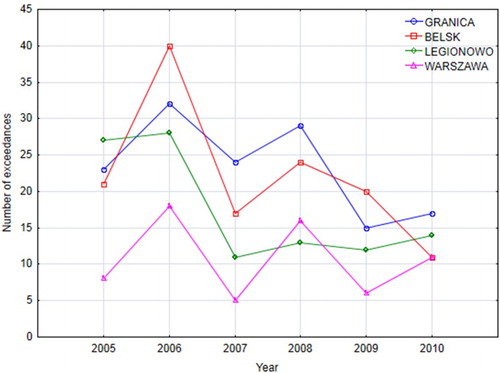
Table 3. Summary statistics of trajectories arriving at analyzed stations in 2005–2010 by sectors, pathways and air masses of atmospheric transport.
Fig. 6 Monthly averaged surface ozone concentration for the 2006 time series.
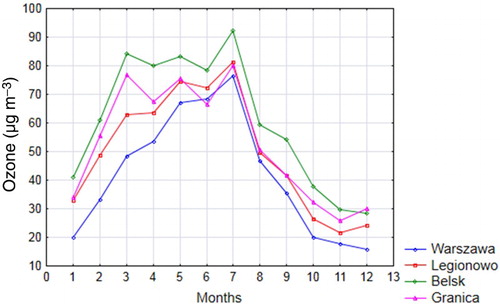
Table 4. Daily averaged concentration for the 2005–2010 time series of O3 and NO2. Numbers in bold indicate the highest values during the week; numbers in bold italic font indicate the lowest values during the week.
Fig. 7 Surface ozone concentrations relative to the average for the 2005–2010 time series where 1 means Monday and 7 Sunday.
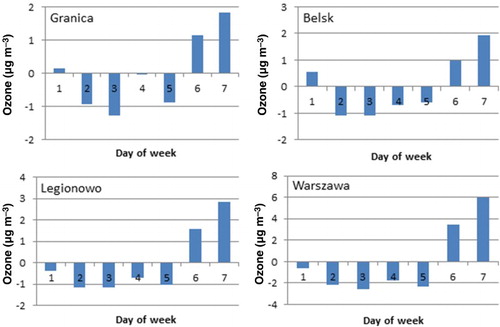
Fig. 8 Nitrogen dioxide concentrations relative to the average for the 2005–2010 time series where 1 means Monday and 7 Sunday.
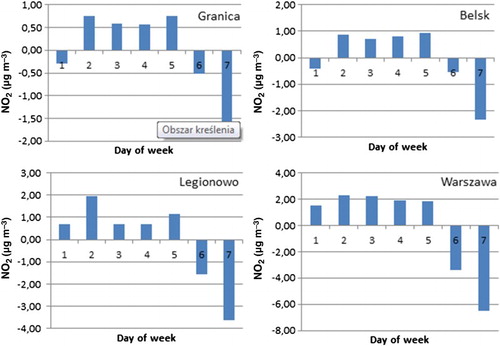
Fig. 9 Diurnal and weekly cycles of surface ozone at an urban (Warszawa) station and a background (Belsk) station for the 2005–2010 time series. Sa-Su: weekend, Wd-weekdays.
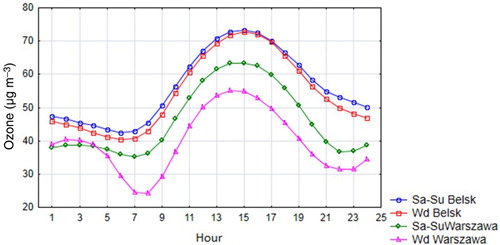
Table 5. Average concentration during weekdays and weekends for the 2005–2010 time series of Ox.
Table 6. Correlation coefficients for seasonal mean surface ozone and meteorological parameters. The statistically significant coefficients at the 95% confidence level are in bold font. The 2010 coefficients for Warszawa were not calculated because the NO2 data for Warszawa were missing (required to calculate Ox). Pressure data for Warszawa station are missing.
Table 7. Results of the multiple regression model for O3 for Belsk and Warszawa stations in winter and summer from 2005 to 2010. R is the correlation coefficient; R2 is the coefficient of determination.
Table 8. Correlation coefficients between the predicted and observed ozone concentrations.
Table 9. Results from the MLP neural network for summer and winter from 2005 to 2010 for Belsk and Warszawa stations.
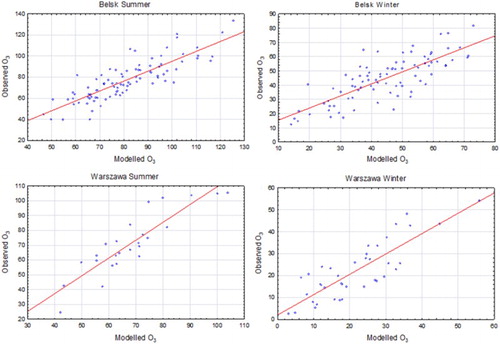
Fig. 10 Comparison of measured and estimated values of O3 for Belsk and Warszawa stations during summer and winter.