Figures & data
Table 1. The six EMAC simulations performed with different boundary conditions.
Fig. 1 Difference in mean temperatures for the years 2000 to 2009 minus 1970 to 1979 (left panel) and 2040 to 2049 minus 2000 to 2009 (right panel) in the EMAC standard simulation.
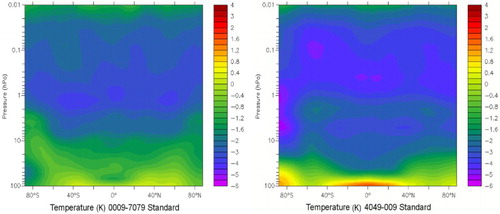
Fig. 2 Contribution of GHGs to the simulated temperature cooling averaged over the years 2040 to 2049. The contribution of GHGs (top left panel; Standard-GHG_fixed), CO2 (top right panel; Standard-CO2_fixed), CH4 (bottom left panel; Standard-CH4_fixed), and N2O (bottom right panel; Standard-N2O_fixed) are derived by subtracting the ten-year temperature mean from 2040 to 2049 of the corresponding sensitivity simulation from the ten-year temperature mean from 2040 to 2049 of the standard simulation.
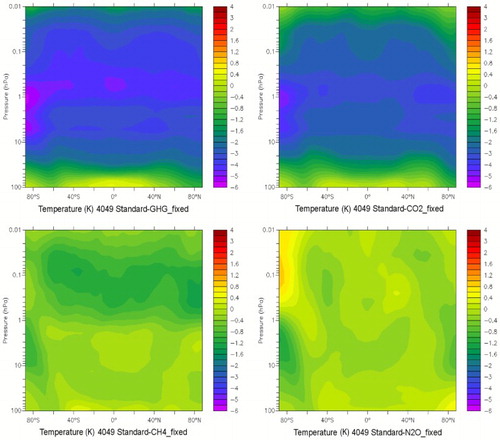
Fig. 3 Contribution of ODS to the simulated temperature changes averaged over the years 2040 to 2049. The contribution of ODS is derived by subtracting the ten-year temperature mean from 2040 to 2049 of the simulation with fixed ODS from the corresponding ten-year temperature mean of the standard simulation (Standard-CFC_fixed).
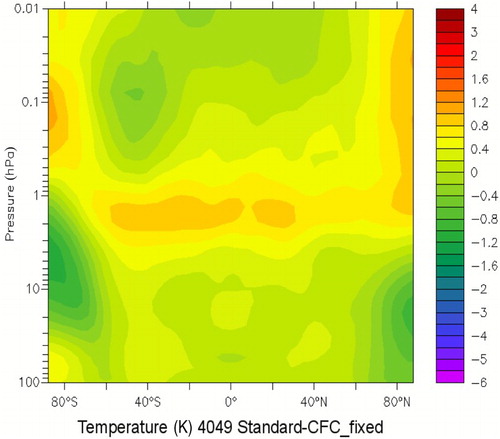
Fig. 4 Simulated ozone depletion and recovery in EMAC. Differences in mean ozone for the years 2000 to 2009 minus the reference period 1970 to 1979 (top panels) and differences for the years 2040 to 2049 minus the reference period 2000 to 2009 (bottom panels) from the standard simulation are illustrated as ozone changes (ppbv) over latitudes and altitudes (left panels) and as time series of ozone columns (Dobson Units) (right panels).
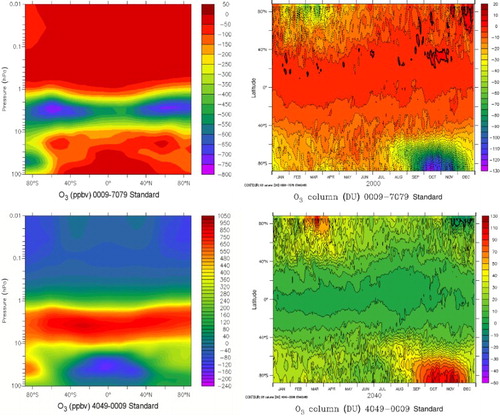
Fig. 5 Contribution of GHGs to simulated ozone development averaged over 2040 to 2049. The contribution of GHGs (top left panel; Standard-GHG_fixed), CO2 (top right panel; Standard-CO2_fixed), CH4 (bottom left panel; Standard-CH4_fixed), and N2O (bottom right panel; Standard-N2O_fixed) are derived as in .
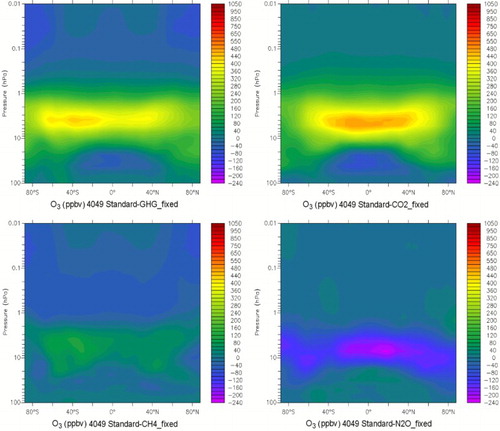
Fig. 6 Contribution of ODS to the simulated ozone development averaged over the years 2040 to 2049 (Standard-CFC_fixed). The contribution of ODS is derived as in .
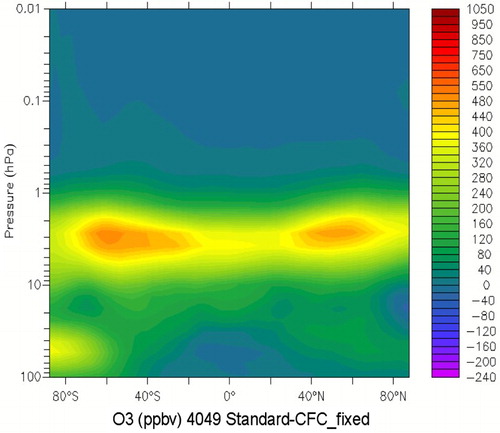
Fig. 7 Distribution of additional N2O (left) and NOx (right) averaged over the years 2040 to 2049 due to the future N2O increase. The additional N2O and NOx are derived by subtracting the ten-year mean from 2040 to 2049 of the simulation with fixed N2O from the corresponding ten-year mean of the standard simulation (Standard-N2O_fixed).
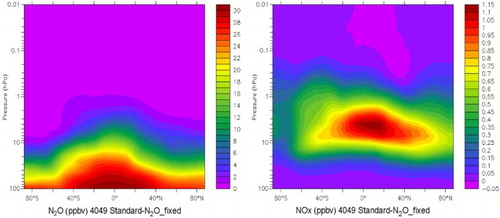
Fig. 8 Distribution of additional H2O (left panel) and HOx (right panel) averaged over the years 2040 to 2049 due to a future CH4 increase. The additional H2O and HOx are derived by subtracting the ten-year mean from 2040 to 2049 of the simulation with fixed N2O from the corresponding ten-year mean of the standard simulation (Standard-CH2_fixed).
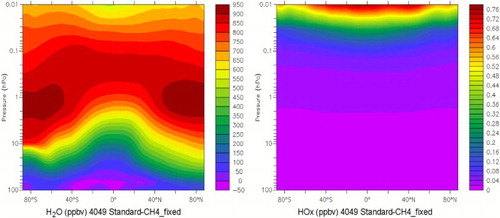
Fig. 9 Dynamical impact on simulated ozone development averaged over the years 2040 to 2049. The dynamical impact is calculated by subtracting the sum of the contributions of CO2, CH4, N2O, and CFCs to the mean ozone change from 2040 to 2049 from the total ozone change from 2040 to 2049 minus 2000 to 2009 of the standard simulation.
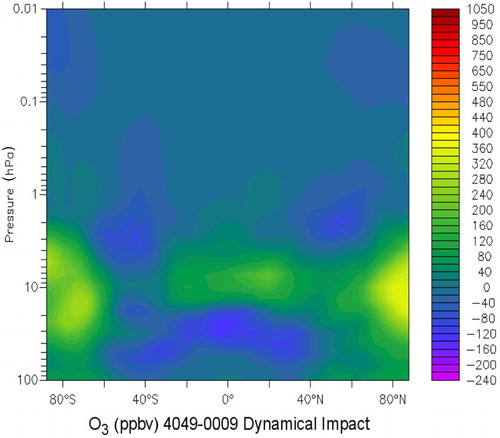
Fig. 10 Annual means of vertical residual (top panel) and meridional (bottom panel) mass fluxes at 54 hPa (approximately 20.5 km) from the standard simulation. Poleward meridional mass flux is positive.
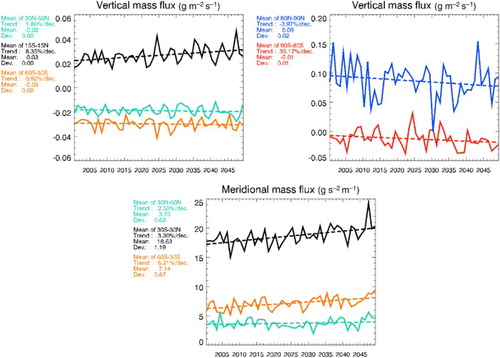
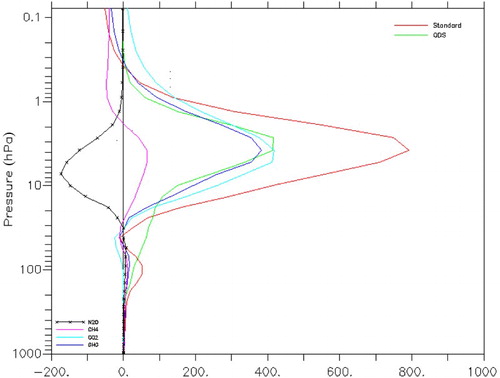
Fig. 11 Simulated ozone change in EMAC simulations. Differences in global ten-year ozone means for the years 2040 to 2049 minus the reference period 2000 to 2009 (total in red) and the contribution from ODS (green), GHGs (blue), CO2 (light blue), CH4 (purple), and N2O (black).