Figures & data
Fig. 1 Model domain and study area. The area of the red box in A indicates the location of the study area B. The straight black line across the Bay of Fundy in A indicates the western boundary of the model domain. The model elements used for power extraction are shown in C. The background colour in B represents water depth and the red contour lines represent the 30 and 80 m isobaths. The red line in B indicates the section used in and .
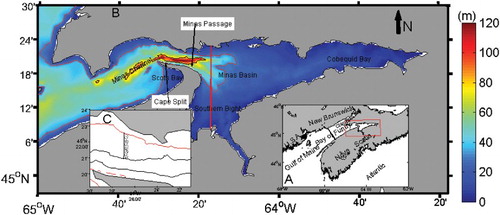
Fig. 2 Schematic arrangement of turbines across the Minas Passage.
Fig. 3 Relation of drag coefficient versus (a) power and (b) flow reduction rate. The circles indicate the location of the 300 MW power level and the crosses indicate the location of the 500 MW power level.
Fig. 4 Changes (defined in text) in (a) and (c) amplitude and (b) and (d) phase of M2 for (a) and (b) Case I and (c) and (d) Case II.
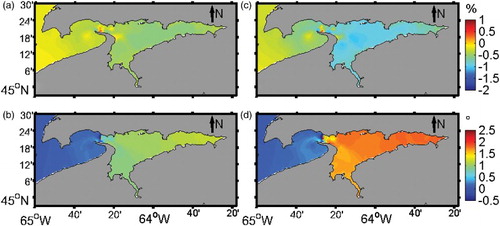
Fig. 5 Changes (defined in text) of mean depth-averaged velocity during (a) and (c) flood and (b) and (d) ebb for (a) and (b) Case I and (c) and (d) Case II. The arrows in the figures represent the direction of the tidal currents from the model run with turbines; their lengths are not scaled by the current magnitudes.
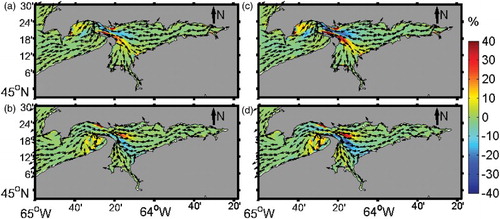
Fig. 6 Differences in residual current field between Case 0 and (a) Case I and (b) Case II.
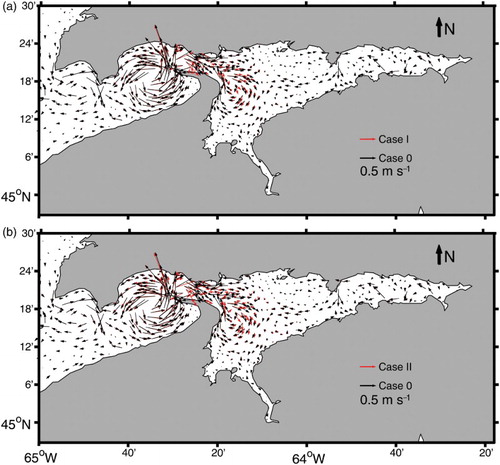
Fig. 7 Components of residual velocity along a section across the west Minas Basin. The location of the section is shown in .
Fig. 8 Changes (defined in text) in mean bottom shear stress during (a) and (c) flood and (b) and (d) ebb for (a) and (b) Case I and (c) and (d) Case II. The arrows in the figures represent the directions of the stress from the model run with turbines, and their lengths are not scaled by the current magnitudes.
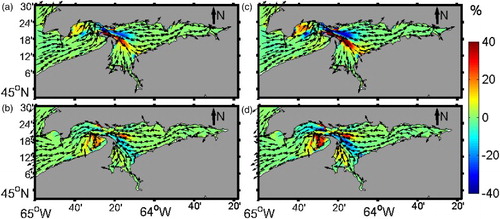
Fig. 9 Changes (defined in text) of bed load transport during (a) and (c) flood and (b) and (d) ebb for (a) and (b) Case I and (c) and (d) Case II. The arrows in the figures represent the direction of the stress from the model run with turbines; their lengths are not scaled by the current magnitudes.
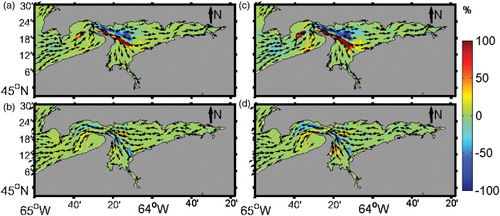
Fig. 10 Changes (defined in text) of suspended load transport during (a) and (c) flood and (b) and (d) ebb for (a) and (b) Case I and (c) and (d) Case II. The arrows in the figures represent the direction of the stress from the model run with turbines; their lengths are not scaled by the current magnitudes.
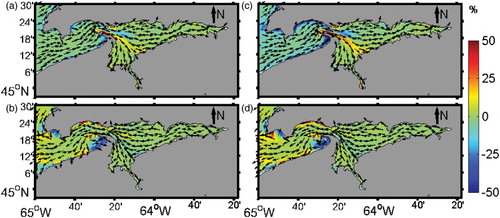
Fig. 11 (a) Mean total load transport rate in tidal cycles and changes (defined in the text) for (b) Case I and (c) Case II. The arrows in the figure represent the directions of the sediment transport rate from the model run with turbines.
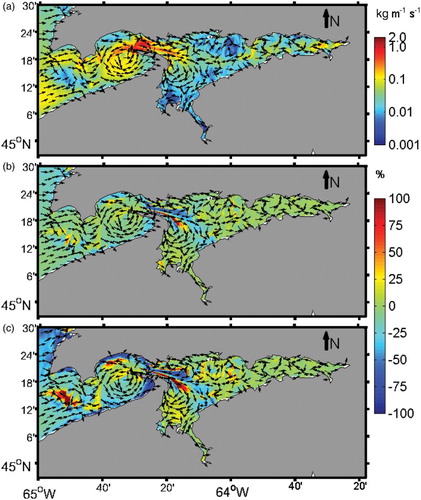
Fig. 12 (a) Transport rates and (b) differences from two power levels along a section across the western area of the Minas Basin (the location of the section is shown in ).