Figures & data
Fig. 1 Model domains for (a) the CRCM and (b) NEMO. Two comparison locations are indicated at “A” (60.9833°W, 47.0333°N) and “B” (60.6333°W, 48.48333°N), which are used in and . SBI: Strait of Belle Isle, GSL: Gulf of St. Lawrence, SLE: St. Lawrence estuary.
Fig. 2 Surface air temperature (°C) in January (upper panels) and July (lower panels), averaged over the 1970–1999 period.
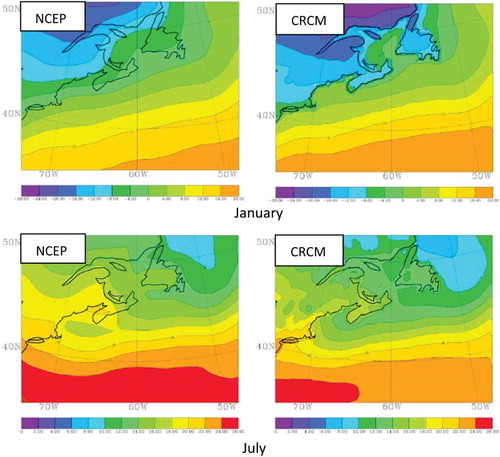
Fig. 3 Wind at 10 m (m s−1) in January (upper panels) and July (lower panels), averaged over the 1970–1999 period.
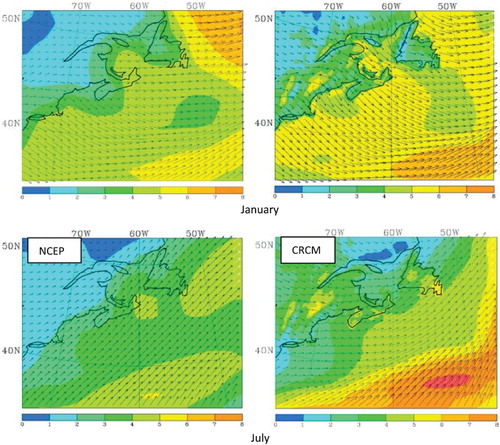
Fig. 4 Monthly ice concentration (colour bar: fractional surface area of all types of ice) from NSIDC data (left panels) and the model simulation (right panels) , averaged over the 1970–1999 period: (a) January, (b) February, and (c) March.
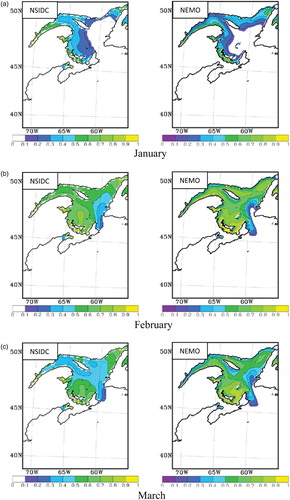
Fig. 5 Monthly ice volume for observations (black) and simulation (red), averaged over the 1970–1999 period.
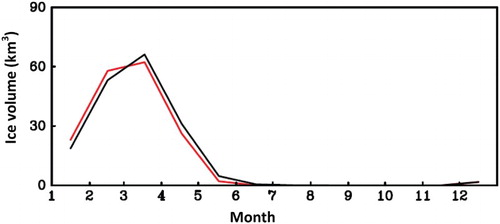
Fig. 6 Sea surface temperature (°C) in January (upper panels) and July (lower panels) for (a) AVHRR satellite observations and (b) simulation, averaged over the 1980–2009 period.
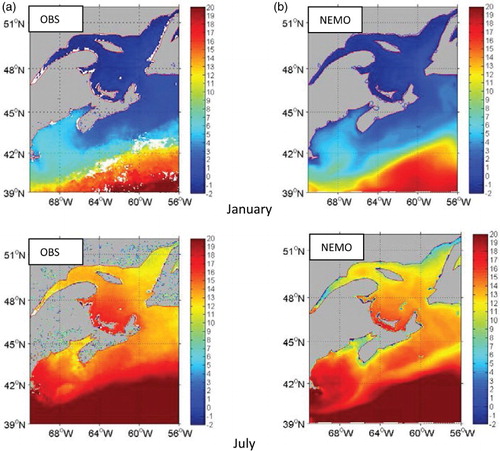
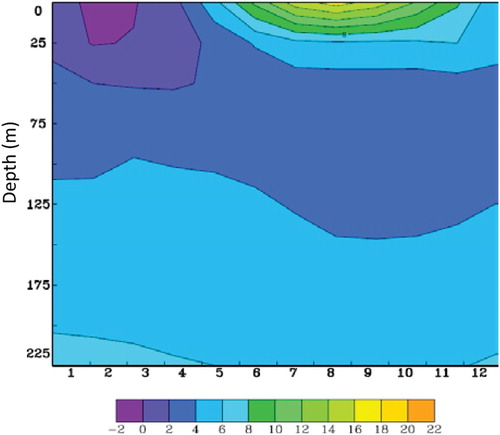
Fig. 7 Time series over the annual cycle, for water temperature (°C; upper panels) and salinity (lower panels) at (60.6333°W, 48.48333°N) comparing observations (left panels) and simulation results (right panels). Numbers on the x-axes indicate months of the year. The location is indicated in .
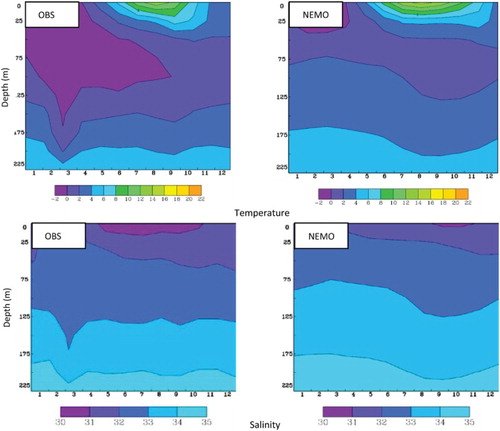
Fig. 8 Time series over the annual cycle for water temperature (°C; upper panels) and salinity (lower panels) at (60.9833°W, 47.0333°N) for observations (left panels) and simulation results (right panels). The location is indicated in .
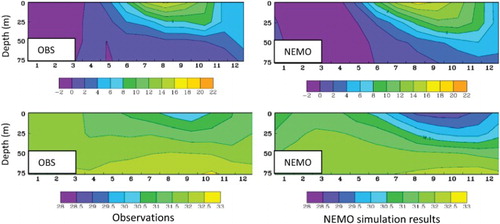
Fig. 9 Differences in surface air temperature (°C) in January (upper panel) and July (lower panel) between the 2069–2040 and 1970–1999 periods.
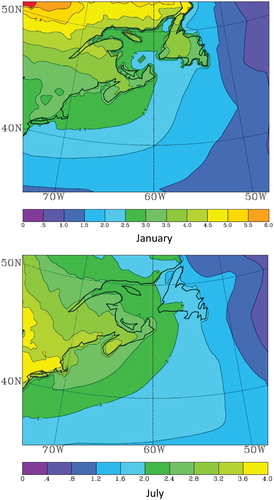
Fig. 10 Differences in 10 m wind speed (m s−1) in January (upper panel) and July (lower panel) between the 2069–2040 and 1970–1999 periods.
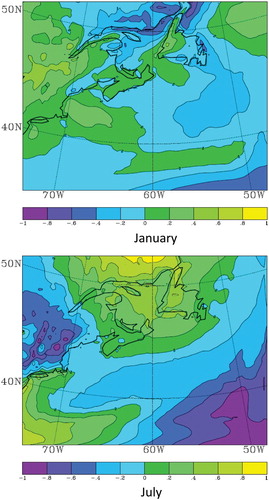
Fig. 11 Time series of ice volume (km3) in March in the Gulf of St. Lawrence.
Fig. 12 Monthly ice concentration (colour bar: fractional surface area of all types of ice), averaged for the 2040–2069 period.
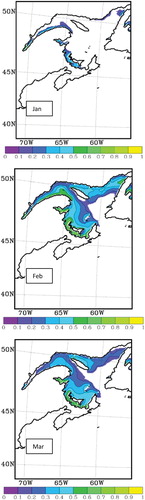
Fig. 13 Differences in sea surface temperature (oC) between the 2040–2069 and 1980–2009 periods in (a) January and (b) July.
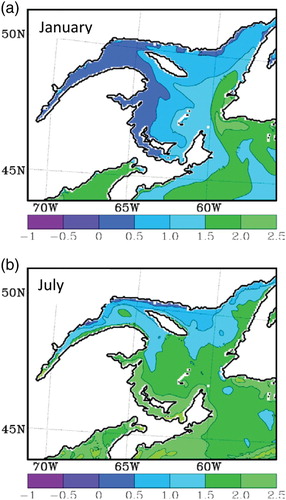
Fig. 14 Differences in sea surface salinity between the 2040–2069 and 1980–2009 periods in (a) January and (b) July.
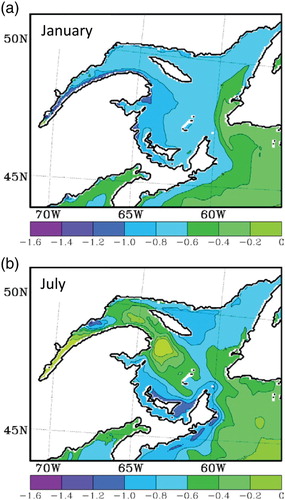
Fig. 15 Differences in annual water temperature (°C) between the 2040–2069 and 1980–2009 periods at (a) the surface, (b) 52 m, and (c) 112 m..
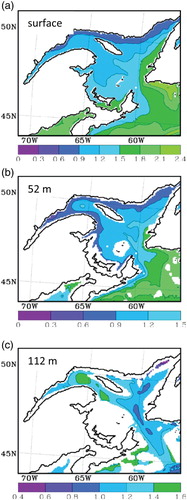
Fig. 16 Differences in annual water salinity between the 2040–2069 and 1980–2009 periods at (a) the surface, (b) 52 m, and (c) 112 m.
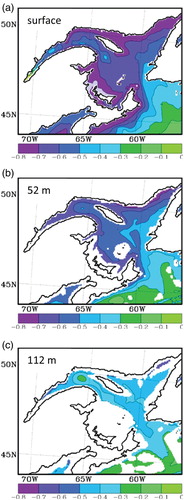
Fig. 17 Time series of water temperature (°C) at 60.6333°W, 48.48333°N, averaged over the 2040–2069 period. The location is indicated in .