Figures & data
Table 1. Domain and sub-regions for which trends of spatially averaged gridded SSTs are presented (), approximated by latitude–longitude boxes with the indicated ranges (also see a). The Mid-latitude WNA TZ refers to the Mid-latitude Western North Atlantic Transition Zone between the subpolar and subtropical gyres (see Brock et al. (Citation2012) for discussion), which is subdivided here into shelf and two off-shelf sub-regions.
Fig. 1 (a) Map showing the NWA sub-region/domain and the five other sub-regions () for which trends are presented in . (b) Map showing locations of the four DFO monitoring sites (P5 denotes Prince 5; EB, Emerald Basin; and S27, Station 27, as well as Bravo), the positions of the gridded data used in the comparison, and ocean areas discussed in the text (LS denotes Labrador Sea; FC, Flemish Cap; GB, Grand Bank; SS, Scotian Shelf; and GoM, Gulf of Maine).
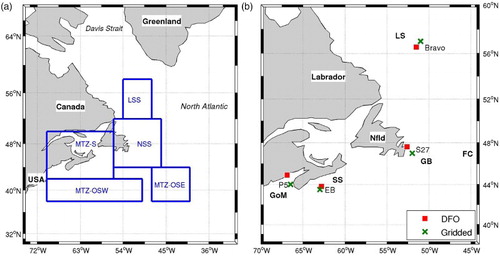
Fig. 2 Time series of forcing indices considered in correlation analyses to explore the origin of the leading modes of SST variability: (a) AMO index and GMST anomalies in the upper panel and winter NAO index in the lower panel; and (b) sea surface height (SSH) PCs in upper panel and wind stress curl (WSC) PC1 and Bermuda-minus-Bravo SSH difference in lower panel, from the Wang et al. (Citation2015) hindcast simulation of the NA during 1958–2004.
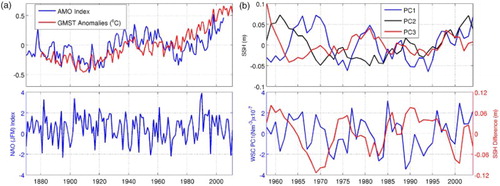
Fig. 3 Time series of (a) annual and (b) summer means of upper-ocean temperature at the four DFO monitoring sites (black), and of SST in the vicinity of the sites from the three gridded historical datasets (coloured lines).
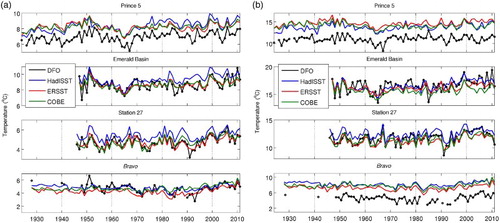
Table 2. Trends in (a) annual mean and (b) summer mean upper-ocean temperature (°C per decade) over the entire period of record at the four DFO monitoring sites, together with the trends in the corresponding gridded SST datasets at nearby positions (i.e., of the time series shown in ) and the average of the trends for the gridded datasets. P5 denotes Prince 5; EB is Emerald Basin; S27 is Station 27; N is the number of years with data. Trends significant at the 95% confidence level (without consideration of autocorrelation in the time series) are in bold.
Table 3. Correlation coefficients between the DFO and various gridded time series at the DFO monitoring sites () after detrending, for annual means and summer means. Correlations significant at the 95% confidence level (without consideration of autocorrelation in the time series) are in bold.
Fig. 4 EOF patterns (°C normalized by the peak value) for the leading three modes for (a) the annual and (b) the summer means of HadISST1 and ERSST for 1870 to 2011 without detrending, with the percentage of explained variance indicated in the inset panels.
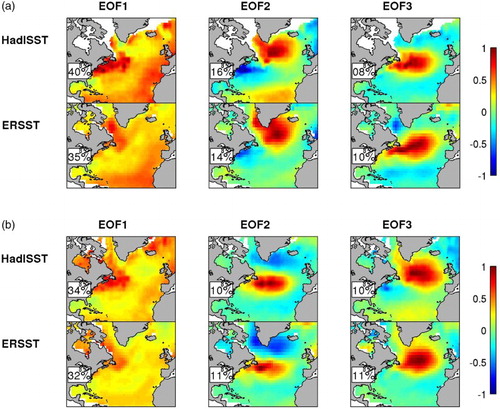
Fig. 5 PCs for the leading three modes for (a) the annual and (b) the summer means of HadISST1 and ERSST for 1870–2011 without detrending.
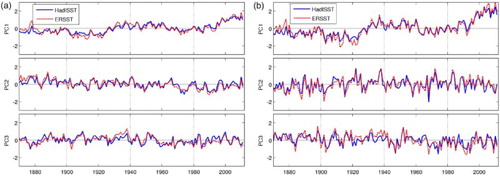
Fig. 6 Annual anomalies of NA SST associated with the PC1s from the EOF analyses on HadISST1 and ERSST from 1870 to 2011 and of GMST from GISS. None of the time series were detrended. The NA SST time series were computed by multiplying the PC1s in a by the spatially averaged amplitude over the NA of the corresponding EOF1 in a.
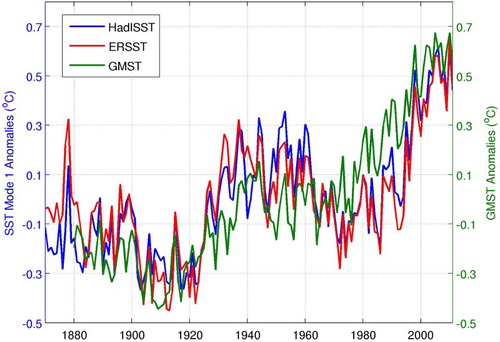
Fig. 7 Trends (°C per decade with the zero contour in white) in the three (a) annual mean and (b) summer mean datasets for the four periods examined. Note that a different temperature trend scale (colour bar) is used for the 1979–2011 periods than for the other three periods.
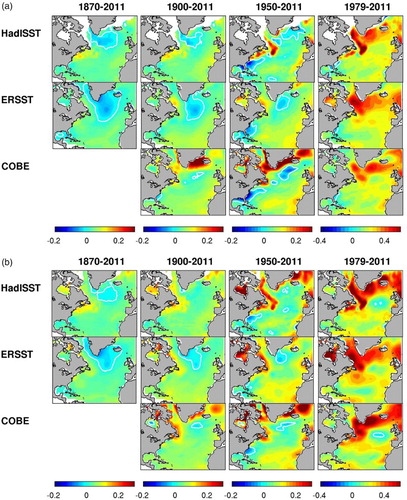
Table 4. Trends in (a) annual mean and (b) summer mean SST (°C per decade) averaged over the latitude/longitude boxes approximating the regions of interest (), from the three gridded SST datasets (HadISST1 (HD), ERSST (ER), and COBE (CB)) and for the three different common periods. Trends significant at the 95% confidence level are in bold. The average (Avg) of the trends over the three datasets is shown after those for the individual datasets. The asterisked (*), italicized values indicate trends affected by the suspect warming around Greenland in the COBE dataset (prior to 1979) and not used in the averages.
Fig. 8 EOF patterns (°C normalized by the peak value) for the (a) annual and (b) summer means of the three datasets for the 1900–2011 period, with the percentage of explained variance indicated in the inset panels (and the suspect annual COBE mode and its variance not included).
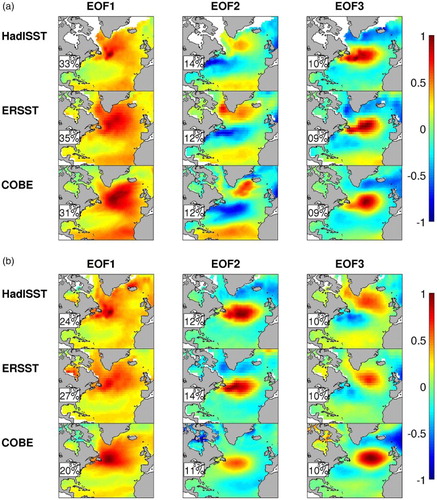
Fig. 9 PCs for (a) the annual mean and (b) the summer mean SST analyses of the three gridded datasets after detrending for the 1900–2011 period.
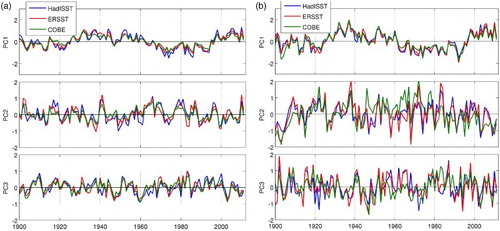
Table 5. Correlation coefficients between the annual mean SST PCs in and potential forcing indices after detrending. The correlations with the AMO and winter NAO indices are for the 1900–2011 period, while those with the SSH and WSC indices from the Wang et al. (Citation2015) hindcast simulation are for the 1958–2004 period. Trends significant at the 95% confidence level are in bold. Be-Br refers to Bermuda SSH minus Bravo SSH
Fig. 10 The low-pass filtered (a) annual mean and (b) summer mean anomalies of upper-ocean temperature (black circles and lines) at the four DFO monitoring sites, together with the contributions to local SST variability from AMO-like mode 1 during the 1900–2011 period in the three detrended gridded datasets (coloured lines: HadISST1 (HD), ERSST (ER), and COBE (CB)).
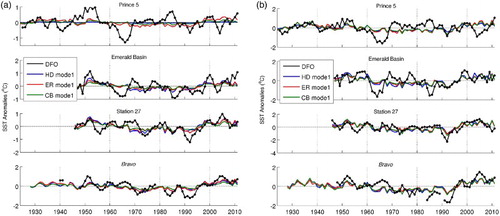
Table 6. Correlation coefficients between the low-pass filtered upper-ocean annual mean temperature anomalies from the four DFO monitoring sites ( and ) and the contributions of the first (AMO-like; left columns), second (NAO-linked; middle columns), and third (ocean-origin; right columns) modes from the EOF analyses of the three gridded datasets during the 1900–2011 period. Both the DFO and gridded dataset indices were detrended before the computations. Coefficients statistically significant at the 95% level are indicated in bold. See for acronyms.
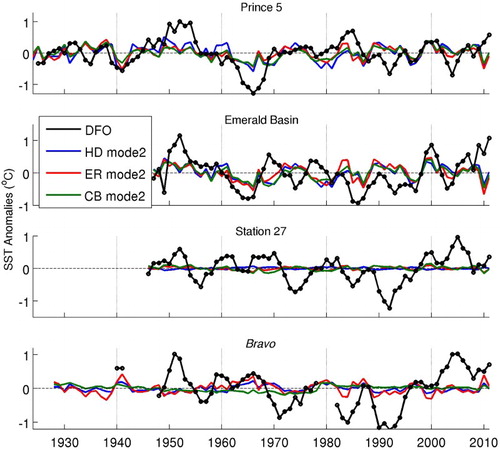
Fig. 11 Low-pass filtered annual mean anomalies of upper-ocean temperature (black circles and lines) at the four DFO sites, together with the contributions to local SST variability from the NAO-linked mode 2 during the 1900–2011 period in the three detrended gridded datasets (coloured lines: same acronyms as in ).