Figures & data
Fig. 1 The seasonal mean of 6-hourly 10 m wind speed (m s−1): (a) QSCAT/NCEP, (b) ERA-40, (c) CFSR, and (d) CRCM.
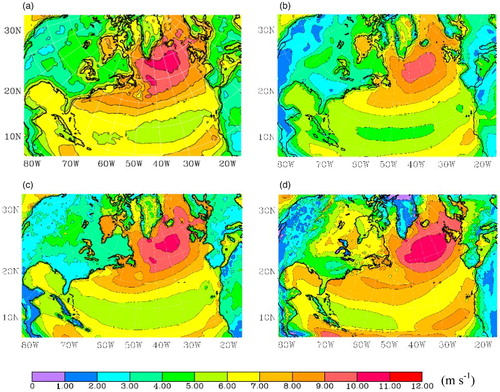
Fig. 2 The mean of 10% strongest 6-hourly 10 m wind speed (m s−1): (a) QSCAT/NCEP, (b) ERA-40, (c) CFSR, and (d) CRCM.
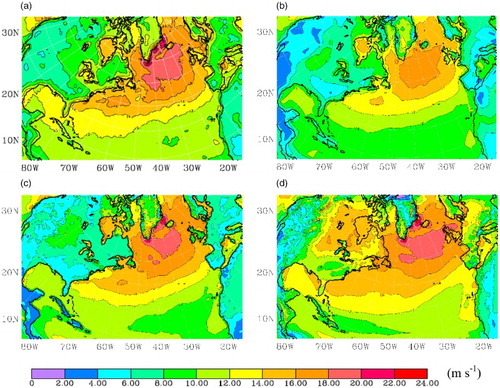
Fig. 3 The frequency (%) of 6-hourly 10 m wind speed ≥15 m s−1: (a) QSCAT/NCEP, (b) ERA-40, (c) CFSR, and (d) CRCM.
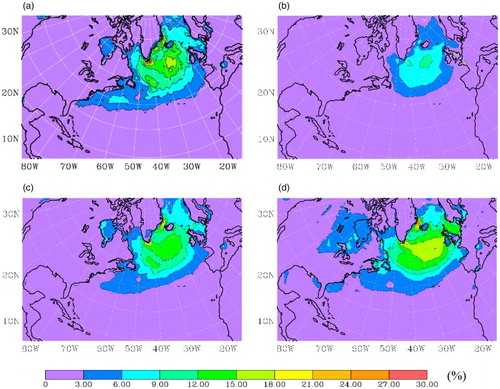
Fig. 4 Storm-track densities (1 yr−1) averaged over the present climate period from (a) ERA-40, (b) NCEP, (c) CFSR, and (d) CRCM.
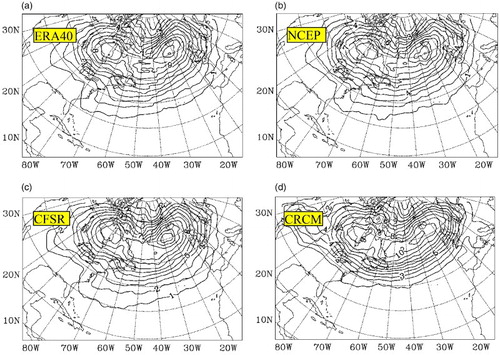
Fig. 5 (a) Frequency (%) of storms as a function of minimum MSLP (hPa) for present climate (1979–1999) cyclones from ERA-40, NCEP, CFSR, and CRCM over the CRCM domain; (b) frequency (%) of storms as a function of maximum 10 m wind speed (m s−1).
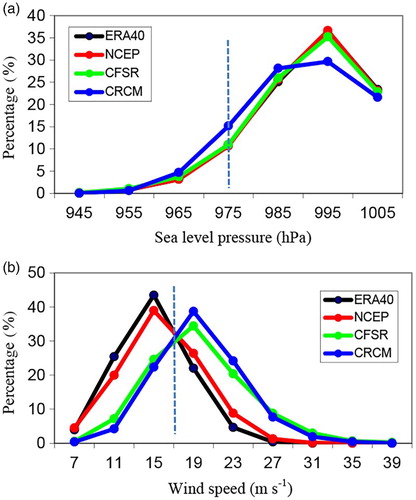
Fig. 6 Seasonal mean SWH (m) from (a) ERA-40, (b) CFSR-w, and (c) CRCM-w; 10% strongest SWH (m) from (d) ERA-40, (e) CFSR-w, and (f) CRCM-w. The contour intervals are 0.5 m for (a)–(c), and 1 m for (d)–(f).
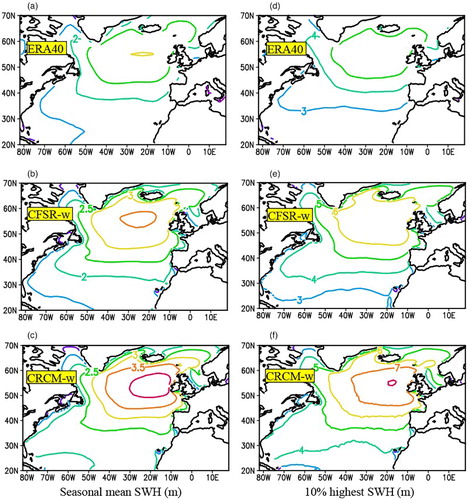
Fig. 7 Seasonal mean wave direction (o): (a) ERA-40, (b) CFSR-w, and (c) CRCM-w. Seasonal mean wave period(s) in (d) ERA-40, (e) CFSR-w, and (f) CRCM-w. The contour intervals are 30o for (a)–(c), and 0.5 s for (d)–(f).
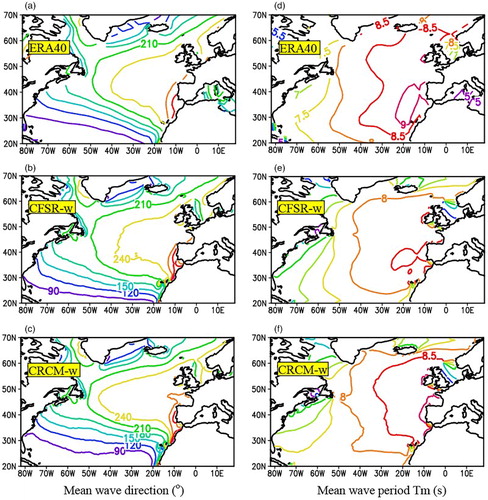
Fig. 8 Seasonal mean inverse wave age in (a) CFSR-w and (b) CRCM-w; the frequency (%) of occurrence of wind-driven waves in results from (c) CFSR-w and (d) CRCM-w; and the frequency (%) of occurrence of swell from (e) CFSR-w and (f) CRCM-w.
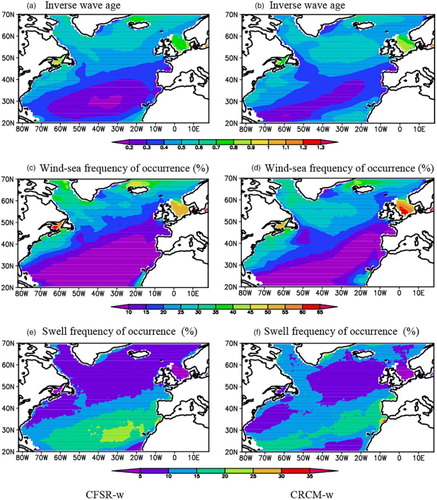
Fig. 9 Estimates from CRCM. (a) Difference in mean 6-hourly 10 m wind speed (m s−1) and (b) difference in 10% strongest 6-hourly 10 m wind speed (m s−1) for the future climate scenario minus the present climate. The contour interval is 0.3 m s−1 for (a) and 0.5 m s−1 for (b). The grey shading indicates the 90% significance level from a Student's t-test.
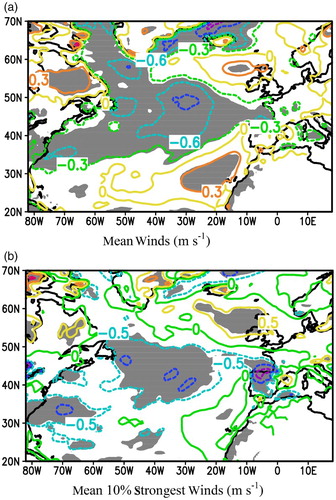
Fig. 10 Cyclone track densities from CRCM. Difference between future climate and present climate for (a) total cyclone track densities, (b) intense cyclone densities (MSLP ≤ 970 hPa), and (c) intense cyclone densities defined in terms of winds (>27 m s−1). Densities are in units of 1 yr−1. Grey shading indicates the 90% significance level from a Student's t-test. The contour intervals are 0.2 yr−1 for (a)–(c).
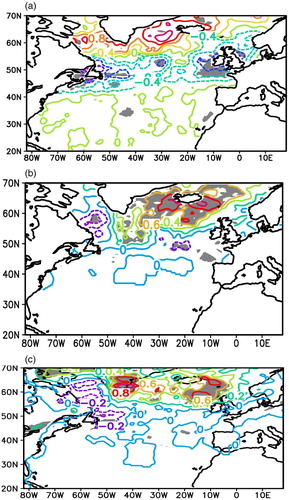
Fig. 11 CRCM simulation of 200 hPa mean westerly winds and jet (m s−1) showing (a) present climate, (b) future climate, (c) difference between future climate and present climate. Also, mean relative vorticity (10−5 s−1) results are shown: (d) present climate, (e) future climate, and (f) difference between future and present climate. Grey shading in (c) and (f) indicates the 90% significance level from a Student's t-test. The black solid and dashed lines in (a) to (c) indicate the locations of maximum wind for each longitude for the present and future climates, respectively. The contour intervals are 5 m s−1 for (a) and (b), 0.5 m s−1 for (c), and 0.2 10−5 s−1 for (f).
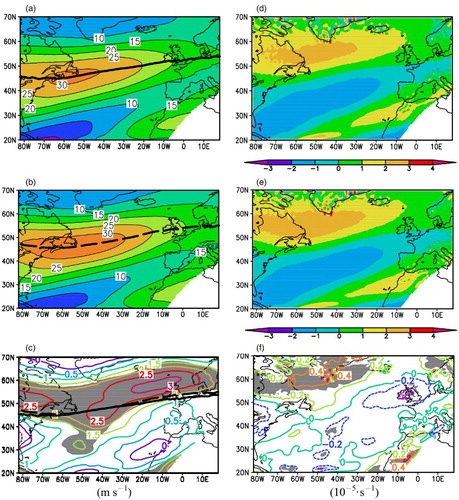
Fig. 12 Differences between future climate scenario and present climate for (a) mean SWH (m) and (b) 10% strongest SWH (m). The contour interval is 0.1 m for (a) and 0.2 m for (b). The grey shading indicates the 90% significance level from a Student's t-test.
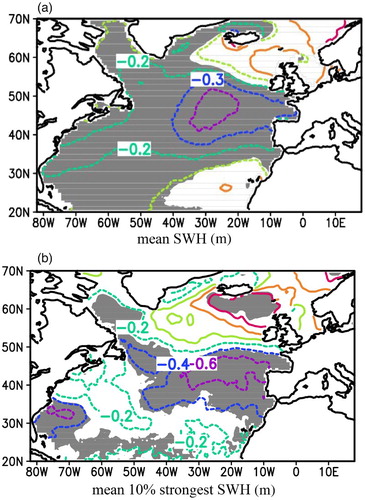
Fig. 13 Differences between future climate scenario and present climate for (a) mean wave direction (o) and (b) mean wave period (s). The contour interval is 5o for (a) and 0.05s for (b). The grey shading indicates the 90% significance level from a Student's t-test.
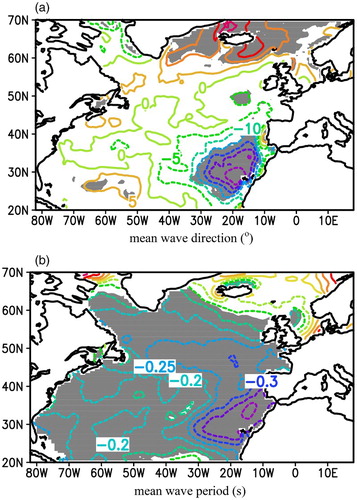
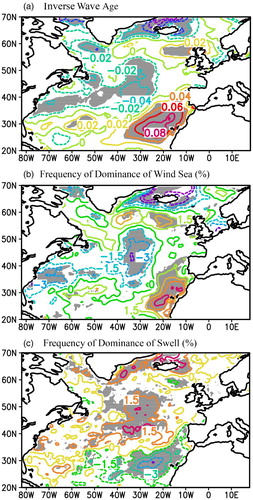
Fig. 14 Differences between future climate scenario and present climate for (a) mean inverse wave age, (b) frequency (%) of dominance of wind-driven waves, and (c) frequency (%) of dominance of swell. The contour interval is 0.02 for (a) and 1.5% for (b) and (c). Grey shading indicates the 90% significance level from a Student's t-test.