Figures & data
Fig. 1 (a) Map of eastern Canada. PEI is Prince Edward Island. Abbreviations for tide-gauge names are listed in . (b) Rates of RSL change and land uplift.
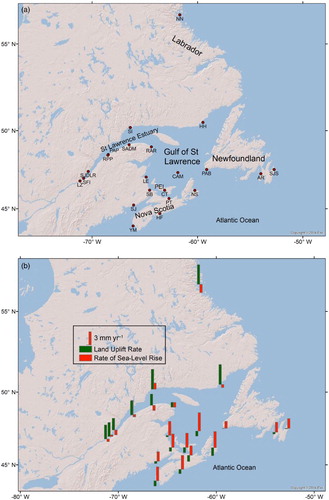
Table 1. Summary of tide-gauge data at 22 stations located along the east coast of Canada.
Table 2. Rate of RSL rise derived from tide-gauge data based on the complete record at each site, and ASL rise derived from tide-gauge and GPS data. Category A represents high-quality level for which t ≥ 50 years and d ≤ 10 km. Category B represents mid-quality level for which 30 ≤ t < 50 years and d ≤ 20 km, and Category C represents low-quality level for usable sites, with 20 ≤ t < 30 years or 20 < d ≤ 40 km. Category F corresponds to unreliable data points for which t < 20 years or d > 40 km.
Fig. 2 (left) Annual means of hourly water levels for five representative sites. Linear trends were fitted using a least-squares fit. Dashed lines mark the range of two standard deviations. (right) Return level versus return period plots for five representative stations. Solid lines are maximum likelihood curves, and dashed lines show the 95% confidence intervals.
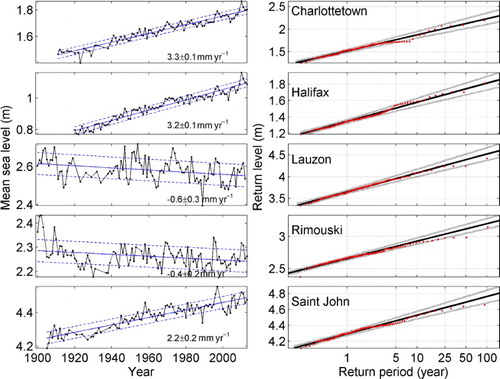
Table 3. Statistics of storm tides derived from tide-gauge data. The third, fifth, and seventh columns are the uncertainty estimates (e.g., the location parameter for Argentia is 1.525 ± 0.057, where the error limits are the 2.5 and 97.5 percentiles).
Fig. 3 (a) Scale parameters and (b) sea-level allowances for RCP8.5_GPS for the 1995–2100 period, estimated from the subsets and full records of detrended annual water level maxima for five tide-gauge stations. The error bars in (a) mark the 2.5–97.5 percentile range.
Table 4. Rates of sea-level change due to the GIA effect estimated from GIA models used for the IPCC's AR5 report.
Table 5. Vertical motion derived from GPS data. Corrected GPS rates are used to estimate the adjusted GIA using a linear relationship.
Fig. 4 Relationship between predicted vertical uplift rate and rate of RSL change for the ICE-5G (VM2) model, version 1.3 (Peltier, Citation2004) and ICE-6G (Peltier et al., Citation2015) indicated by red dots. The solid blue line is the regression: < Rate of relative sea-level change > = –0.9167 < vertical uplift > –0.1947. The dashed lines mark the range of two standard deviations of the error.
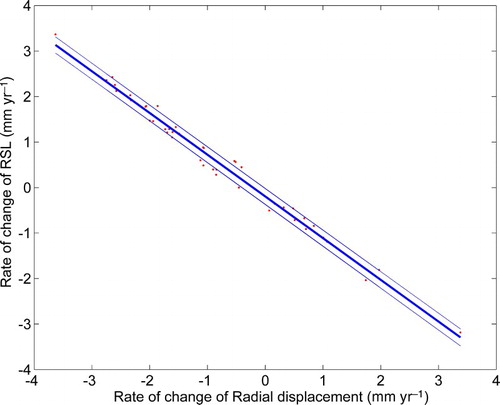
Fig. 5 (a) The rate of RSL change (mm yr−1) derived from tide-gauge data versus the adjusted GIA rate based on GPS observations. The solid line was constrained to a slope of −1. (b) Modelled GIA rate (based on the average of ICE-5G and ANU models (Church et al., Citation2013)) versus adjusted GIA rate based on GPS observations. The solid blue line is the regression: <Adjusted GIA rate> = 0.96 < Modelled GIA rate> + 0.57. The error bars in the y-direction mark the two standard deviation range. The error bars in the x-direction mark the absolute difference of the two GIA models.

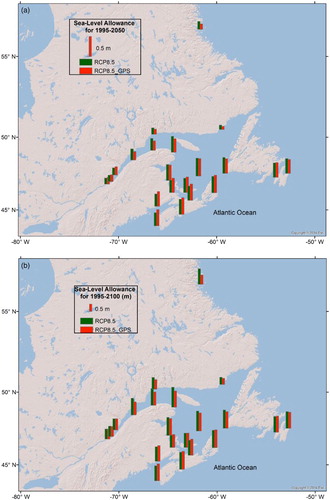
Fig. 6 Sea-level allowances at tide-gauge stations along the Atlantic coast of Canada (a) for the 1995–2050 period and (b) for the 1995–2100 period. Green vertical bars show the sea-level allowances for RCP8.5, and the red vertical bars show the sea-level allowances for which the modelled GIA projections are replaced by the adjusted GIA projections based on GPS uplift rates. The scale of the red vertical bar in the legend is 0.5 m.