Figures & data
Fig. 1 Locations of the 22 pairs of stations where overlapping records were assessed in this study.
Table 1. Metadata for the 22 pairs of stations. The “*” indicates automated stations with daily temperatures modified to match the observing window at staffed stations; “**” indicates that only the daily maximum temperatures were modified for the observing time; “***” indicates that there is only 1.1 yr of overlapping data for maximum temperature and 0.5 yr of overlapping data for minimum temperature at Moose Jaw. plt, mlt, clt, elt, nlt specify Pacific, Mountain, Central, Eastern, and Newfoundland Local Time. Staffed station instruments are liquid-in-glass thermometers or thermistors with electronic Remote Temperature Indicators (RTI).
Fig. 2 Differences between (a) manual and original automated daily maximum temperatures (Tx); (b) manual and original automated daily minimum temperatures (Tn); (c) manual and modified automated daily maximum temperatures; and (d) manual and modified automated daily minimum temperatures at Dawson from 1995 to 2005. The modified automated daily data are the data modified to diminish the effect of different observing times.
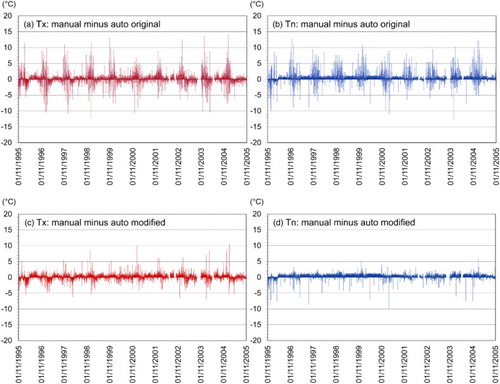
Fig. 3 Examples of biases for (a) daily maximum temperature at Regina; (b) daily maximum temperature at La Ronge; (c) daily minimum temperature at La Ronge; and (d) daily maximum temperature at Tuktoyaktuk. The left panels show the average two-year seasonal-by-wind biases for specific wind categories and the average seasonal biases. The right panels indicate the count of events for the seasonal-by-wind bias and seasonal bias.
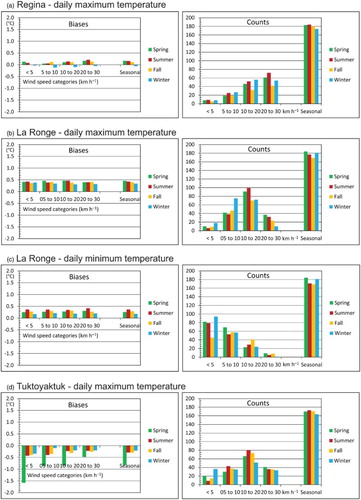
Fig. 4 Box plots showing the 5th, 25th, 50th, 75th, and 95th percentiles of the differences (°C in absolute value) between unadjusted and adjusted observations from automated and staffed stations of (a) daily maximum and (b) daily minimum temperatures at Sprague; the abbreviations along the horizontal axis are explained in Section 4.b.
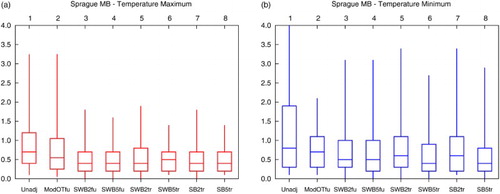
Table 2. Mean Absolute Difference (MAD) between the unadjusted and adjusted maximum and minimum temperatures from automated and staffed stations. The daily temperatures from automated stations 1–13 were modified for the observing time, and the daily temperatures from automated stations 14–23 were not modified for the observing time. Columns 5 to 8 have no values if the overlapping period is shorter than two and/or five years, respectively; columns 9 and 10 have no values if there is no statistically significant shift (at the 0.05 level) detected at the joining date by statistical methods (see Section 6.a). The “*” indicates that only daily maximum temperatures were modified for the observing time for Tuktoyaktuk. The “**” indicates that no wind categorization was applied to either Edmonton or Dauphin maximum or minimum temperatures or to the Gillam minimum temperature: the seasonal bias is substituted for the seasonal-by-wind bias. The results in bold (column 2) give the adjustment for the observing time; the results in italics (columns 3 and 4) give the series for the full period; the results in bold italic (columns 5-8) give the results for the trimmed series.
Table 3. MADs between conventional and automated stations for days adjusted by largest wind biases at select stations with well-defined wind dependence.
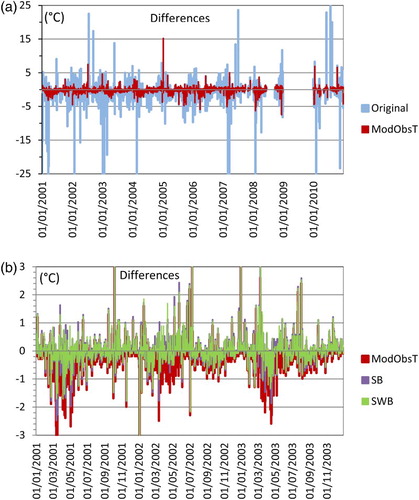
Fig. 5 Differences in daily maximum temperature between the conventional station and automated station at Tuktoyaktuk: (a) between original daily values (blue) and after modification for the observing time at the automated station (red) and (b) after modification for the observing time at the automated station (red); as well as after it was adjusted for seasonality (purple) and both seasonality and wind dependence (green).