Figures & data
Fig. 1 Bathymetry of the study area (contour interval is 30 m).
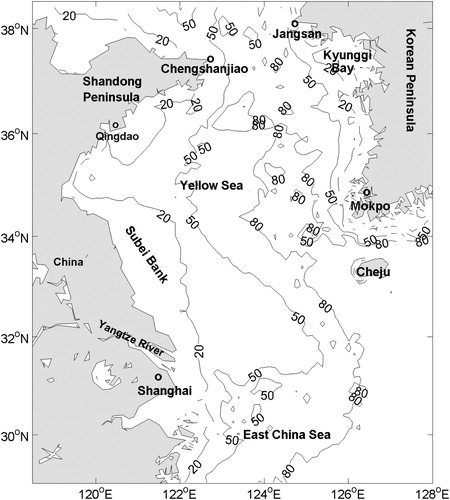
Fig. 2 Monthly SST (°C) climatology (2003–2016) based on MODIS-Aqua and MODIS-Terra measurements from April to November. The SCPs are marked by a dashed ellipse during summer and the three lines used to calculate |ST| are shown in the June subplot.
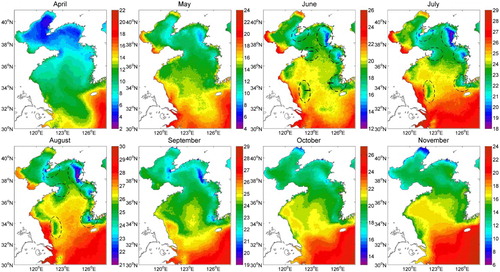
Fig. 3 Annual cycles of (°C km−1; from MODIS) off (a) the Subei coast (122.2°–122.5°E, 33.7°N), (b) Shandong Peninsula (122.7°–122.9°E, 37.35°N), and (c) Mokpo (124.8°–125.3°E, 34.4°N).
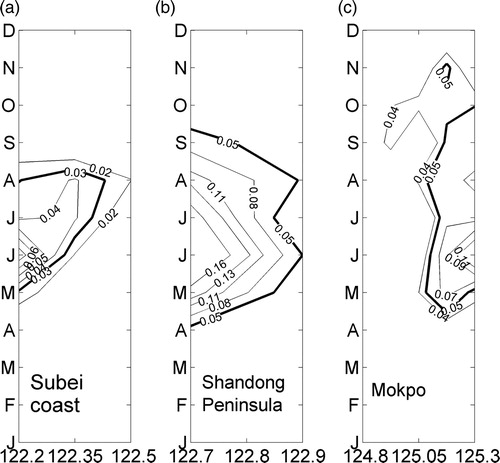
Fig. 4 Simulated cotidal charts for (a) M2, (b) S2, (c) K1, and (d) O1 tidal constituents. Dashed and solid lines denote phase lag (degree; with respect to Beijing standard time (utc + 8 h)) and amplitude (cm), respectively.
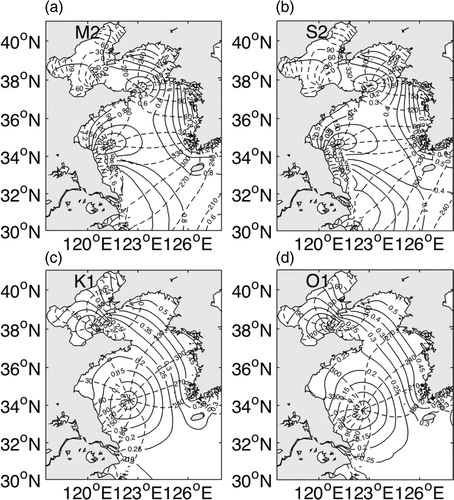
Fig. 5 Distribution of monthly mean SST (°C) for July to August of 2009–2013 from (a) MODIS and (b) model results. The SCPs are marked with dashed ellipses. Locations of stations referred to in are indicated by asterisks.
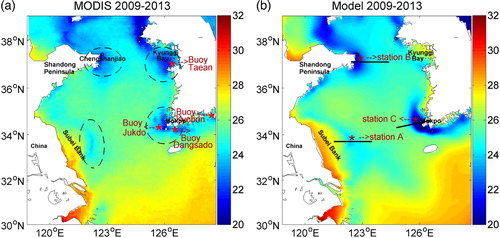
Fig. 6 (a) KODC hydrographic mean SST for the summers of 2010 to 2013 (22–27 August 2010; 1–5 July 2011; 10–18 August 2012; 13–20 August 2013). (b) As in (a) but for modelled SST. Contours denote the bathymetry of the Yellow Sea (contour interval is 25 m).
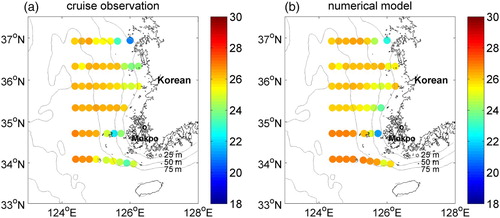
Fig. 7 Time series of modelled temperature (°C) at station A for July and August of 2009–2013. (a) Raw time series and (b) band-pass (7–21 days) filtered time series. The asterisks indicate the times of the spring tide, while the circles mark the times of the neap tide. The blue and red vertical bars in (b) represent the spring and neap tidal phases, respectively.
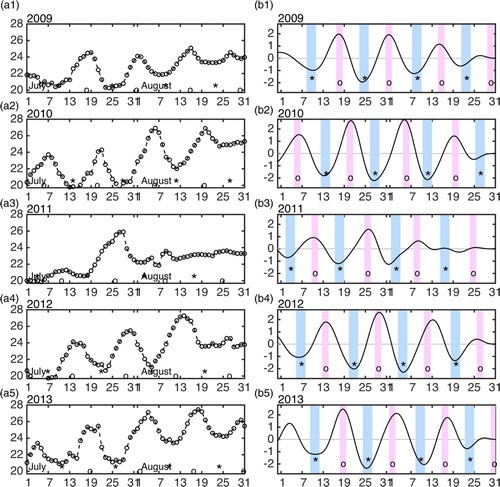
Fig. 8 Time-depth distribution of the modelled and reconstructed data at station A (b) for July and August 2012. The rows from top to bottom are (a) temperature (°C), (b) vertical velocity (m s−1), (c) vertical diffusivity (m2 s−1), (d) horizontal current (m s−1), (e) reconstructed tidal current velocity (m s−1), and (f) surface elevation (m). The asterisks indicate the times of the spring tide, while the circles denote the times of the neap tide.
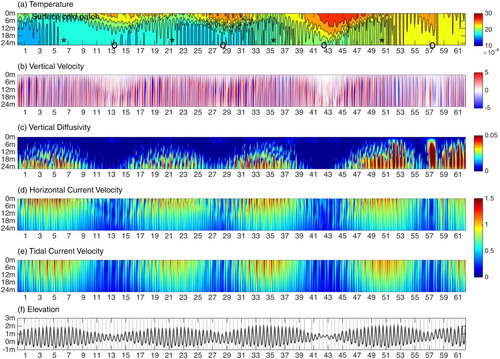
Fig. 9 Temperature profiles (°C) along 33.7°N from 1 to 31 August 2012. The 22° to 26°C isolines (with a 1°C interval) are contoured.
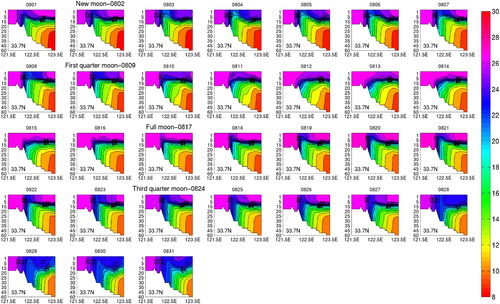
Fig. 10 Section profiles of temperature (°C) for the (a) spring mean, (b) neap mean, and (c) their difference (spring minus neap) along 33.7°N, from 121.5°E to 123.5°E off the Subei coast.
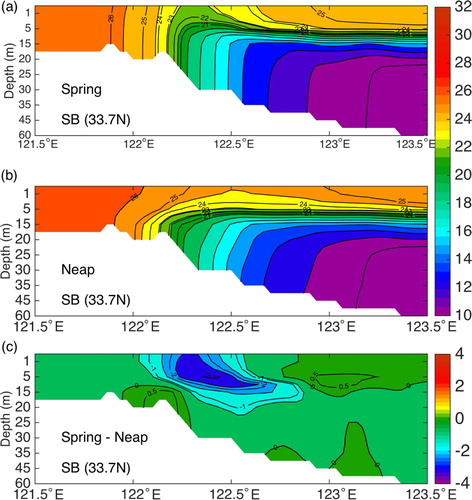
Fig. 11 As in , but for station B.
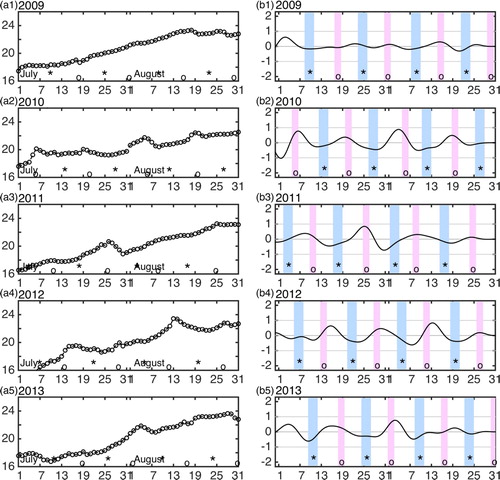
Fig. 12 As in , but for station B.
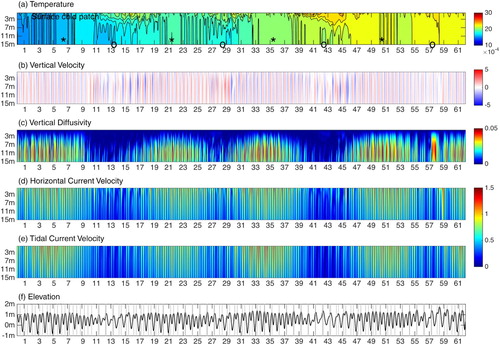
Fig. 13 As in , but for the profiles off Shandong Peninsula.
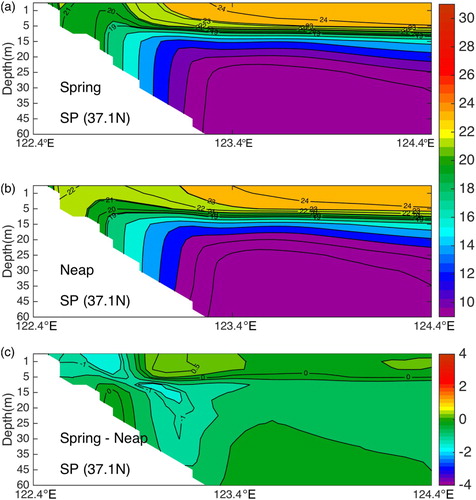
Fig. 14 As in , but for station C.
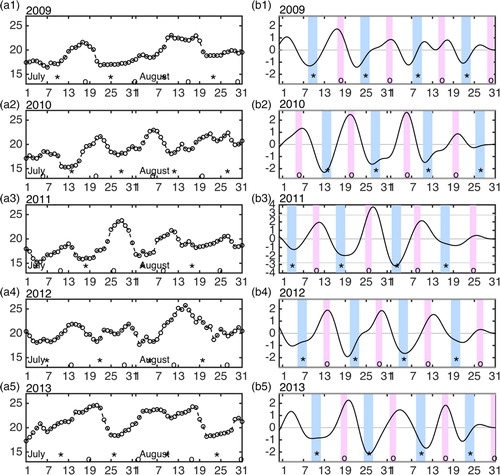
Fig. 15 As in , but for station C.
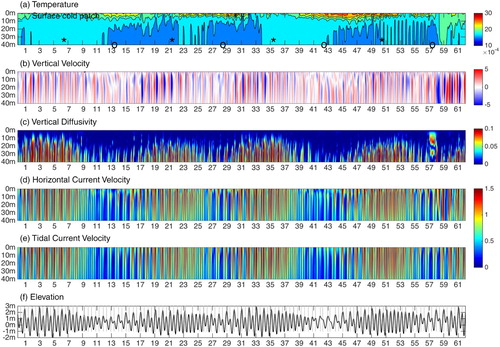
Fig. 16 As in , but for the profile off Mokpo.
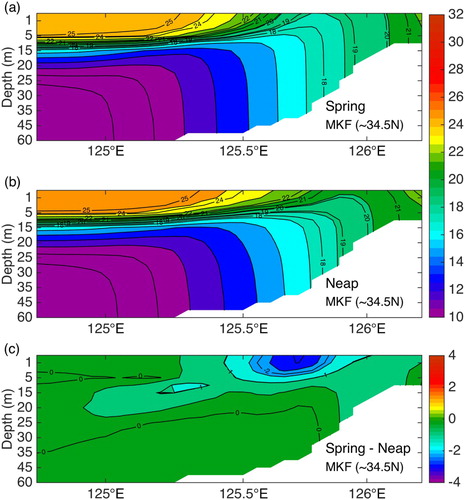
Fig. 17 MODIS SST (°C) fluctuations over a spring–neap tidal cycle in the Yellow Sea. (a) MODIS SST (°C) averaged for July and August of 2003–2015 and SST anomalies during (b) spring tides and (c) neap tides.
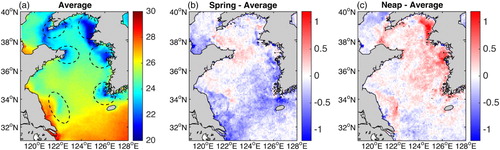
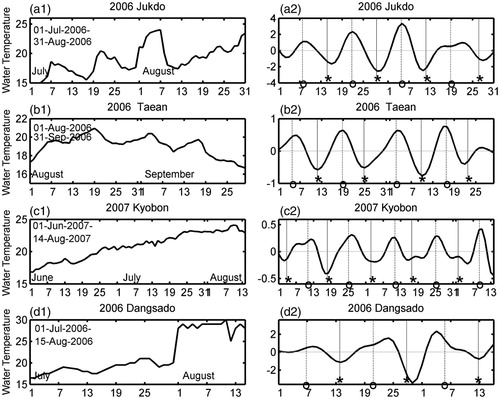
Fig. 18 Raw time series of temperature (°C) from buoy observations at (a1) Jukdo (125.51°E, 34.13°N), (b1) Taean (126.24°E, 36.91°N), (c1) Kyobon (128.31°E, 34.70°N), and (d1) Dangsado (126.36°E, 34.05°N). Band-pass filtered (7–21 days) time series of temperature (°C) for (a2) Jukdo, (b2) Taean, (c2) Kyobon, and (d2) Dangsado. Asterisks indicate the times of the spring tide, while the circles mark the times of the neap tide. Buoy locations are shown in a.