Figures & data
Fig. 1 (a) Bathymetry (m) for the two-domain, one-way nesting model. The yellow and green dots mark the stations for OA, and the red ones are those listed in for validation. The red box indicates the inner domain (L1). (b) Enlarged view of the ECS, namely, L1. The sections where the fluxes are calculated are shown. A: Taiwan Strait, B: East of Taiwan, C: Ishigaki to Naha, D: Naha to Amami, E: Tokara Strait, F: Tsushima Strait, G: from Ishigaki northward to 27.5°N. Also marked is a section of the East China coast (dashed purple line).
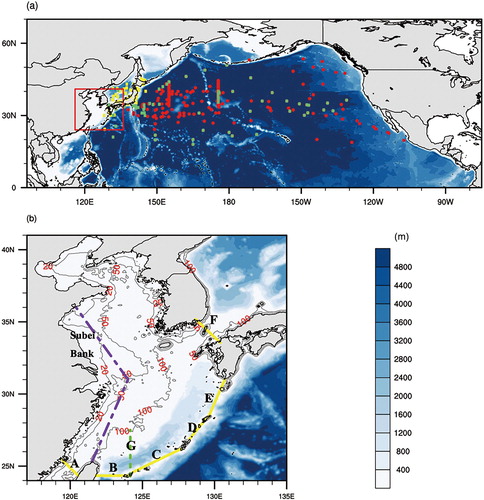
Table 1. Parameters for the two-domain nested ROMS model.
Table 6. 137Cs concentrations from the IAEA observations in the North Pacific, Run 1, and Run 2 (January–March 2012)a.
Table 2. Tidal constituents.
Table 3. Comparison of surface layer (0.5 m) 137Cs radioactive concentration between observations (Wu et al., Citation2013) and simulations in this study.
Fig. 2 Annual mean sea surface temperature (SST) and velocity for 2011 in the North Pacific Ocean. The left and right columns show the distributions of SST and speed, respectively; the velocity vectors are superimposed on the maps. (a) and (b) show the results from our simulation, and (c) and (d) are derived from SODA. (e) and (f) show the difference between model outputs and SODA data.
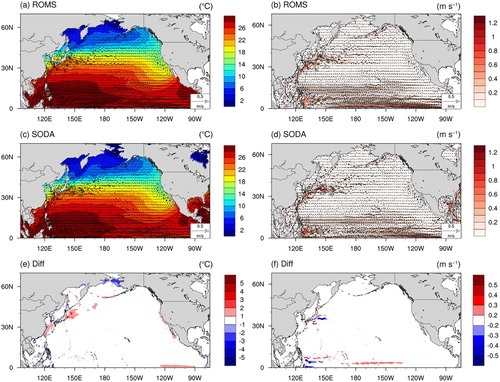
Fig. 3 ECS SST (shaded) and velocity (vectors) in winter and summer. (a) ROMS outputs, February; (b) HYCOM result, February; (c) ROMS outputs, August; and (d) HYCOM result, August.
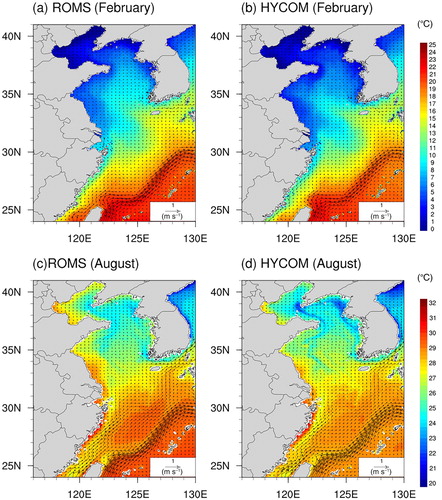
Table 4. Observations and the simulation output around ST-1 in 2012.
Fig. 4 Simulated surface distribution of 137Cs in the North Pacific.
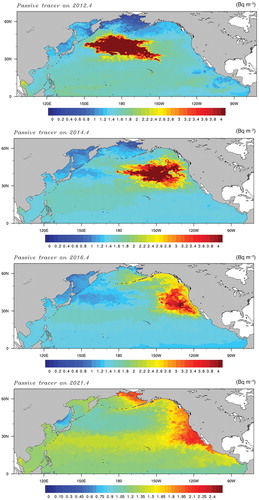
Fig. 5 Vertical profiles of 137Cs at specific Pacific stations in our simulation.
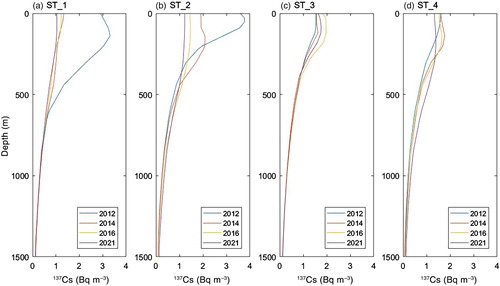
Table 5. Observations and the simulation output around ST-2 in 2012.
Fig. 6 (a)–(f) Time series of the 137Cs fluxes across the six waterways indicated in b (106 Bq s−1). Positive values indicate fluxes into the ECS; black lines are the moving averages with a window of 6 months. In (a) the red line (moving average in green) indicates the difference between the fluxes across the two sections B and G in b. (b) The red curve (moving average in green) is the flux across section G. (g) Total accumulation of nuclear pollutants in ECS (PBq). In all the panels, the April–September periods are shaded in yellow.
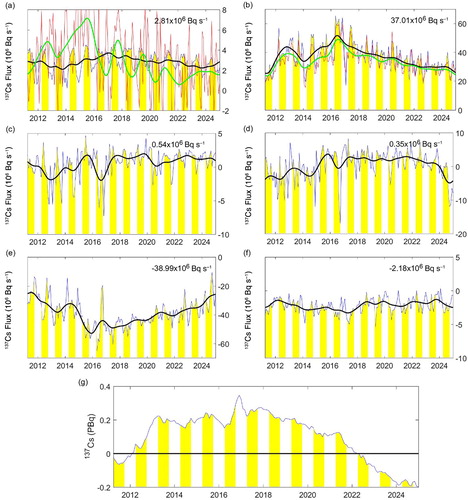
Table 7. Inflow flux through the six sections averaged over the period April 2011–December 2025. Negative values indicate outflow fluxes.
Fig. 7 (a) Distribution of the simulated maximum surface 137Cs concentration (lines, Bq m−3) and the year when it was attained (see colour bar). (b) Distribution of the maximum monthly mean 137Cs radioactive concentration (lines, Bq m−3) and the months when the maximum was attained (shaded). The monthly mean is taken over the same months from 2014 to 2019. (c) Hovmöller diagram of 137Cs concentration (shaded, Bq m−3) between 25°N and 37°N (green line in b) along the East China coast from 2011 to 2022.
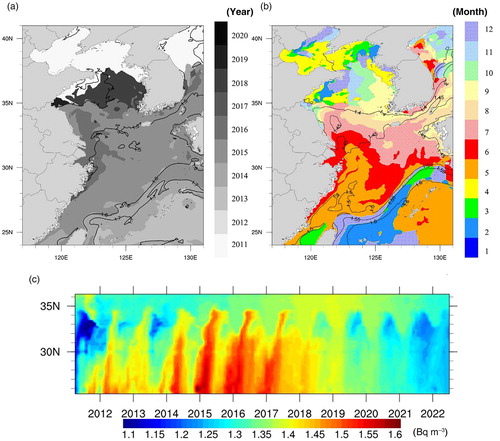
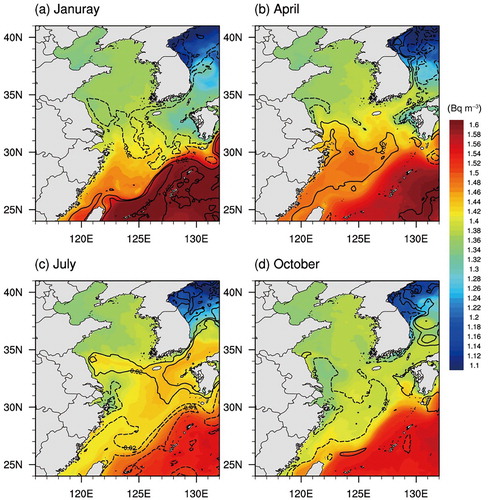
Fig. 8 Distributions of monthly mean surface 137Cs concentration in the ECS from 2014 to 2019 for (a) January, (b) April, (c) July, and (d) October.