Figures & data
Fig. 1 (a) AMJ TT (K) for the PRE99 period. (b) As in (a), but for the POST99 period. (c) Difference between (a) and (b). The regions in (c) enclosed by white contours are significantly different from zero at the 99.9% confidence level based on a Student's t-test. The regions indicated by the rectangular boxes are A (57°–82°E, 27°–44°N) and B (89°–105°E, 28°–38°N).
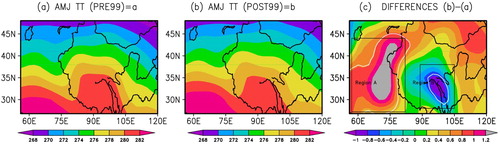
Fig. 2 (a) Zonal wind shear regressed onto ∇TT. (b) Meridional wind shear regressed onto ∇TT. (c) Wind vectors (m s−1) regressed onto ∇TT (the regions enclosed by white contours are statistically significant at the 99% level based on a Student’s t-test). The regressions are for AMJ from 1988 to 2009.
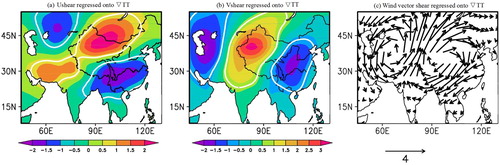
Fig. 3 (a) SSWF and (b) OLR regressed onto ∇TT for AMJ from 1988 to 2009 (the regions enclosed by white contours are statistically significant at the 99% level based on a Student’s t-test).
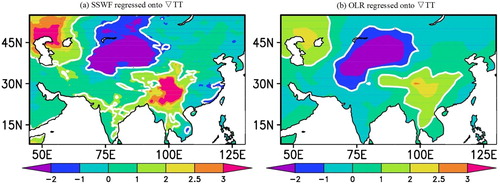
Fig. 4 The causality (information flow) from ∇TT to (a) OLR (b) SSWF, and (c) precipitation for AMJ from 1988 to 2009. Units are nats d−1. The numbers are significant at the 95% level (those inside the white areas are insignificant).
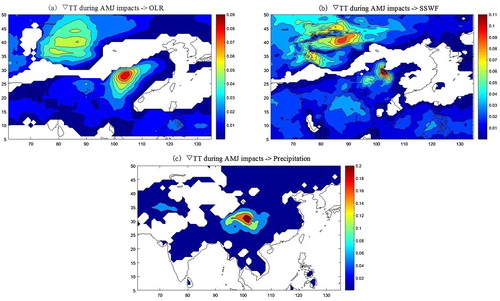
Fig. 5 The difference between the AMJ wind shear (m s−1) (POST99 minus PRE99). The regions enclosed by black contours are statistically significant at the 99% level based on a Student’s t-test.
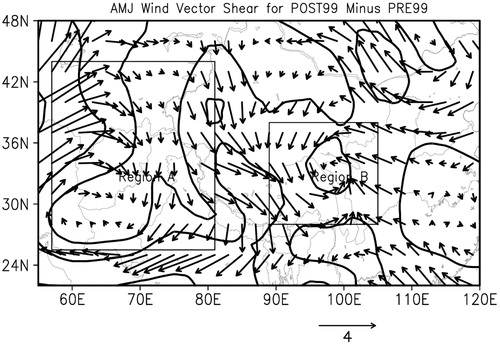
Fig. 6 ∇TT (K) for the (a) PRE99 period and (b) POST99 period. The difference between (a) and (b) is significantly different from zero at the 99% level based on a Student's t-test.
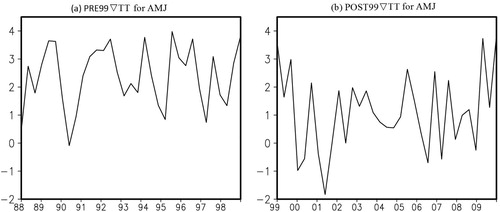
Fig. 7 Moisture flux (×108 kg s−1) across the meridional wall (at 85°E, from 29° to 39°N) for the (a) PRE99 period and (b) POST99 period. Moisture flux (×108 kg s−1) across the zonal wall (at 29°N, from 75° to 95°E) for the (c) PRE99 period and (d) POST99 period. In the left column, the time ends at June 1999, while in the right column, the time begins in April 1999. The moisture fluxes across the meridional wall and zonal wall are found to be statistically significant at the 99% level based on a Student's t-test.
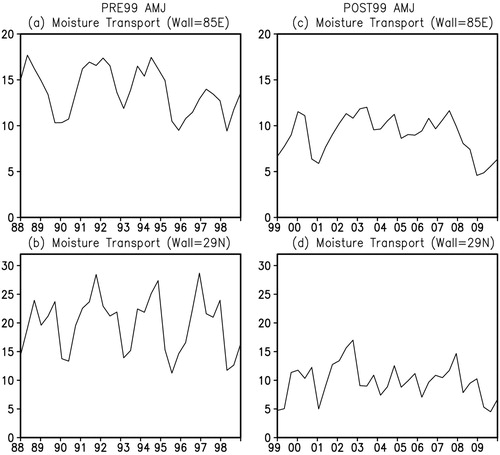
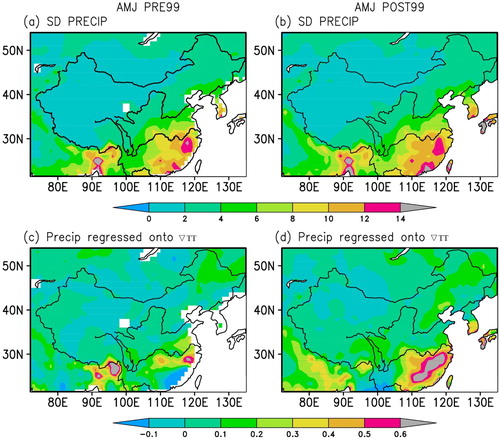
Fig. 8 Standard deviation of the precipitation during AMJ for the (a) PRE99 period and (b) POST99 period. Precipitation variability regressed (statistically significant at the 99% level based on a Student’s t-test) onto ∇TT for the (c) PRE99 period and (d) POST99 period.