Figures & data
Fig. 1 Location of Lake Taihu, the study area. The ODW and OSW sites are shown on the map.
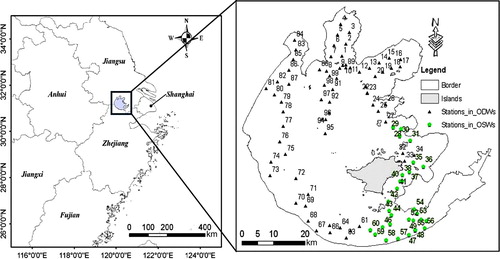
Fig. 2 Total absorption spectra a(λ) (left) and total backscattering coefficients bb(λ) (right) at all available sites in Lake Taihu.
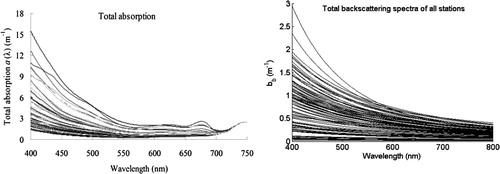
Table 1. Selected sites and their corresponding chl a concentrations.
Fig. 3 (a) Comparison of the standard deviation of the measured and simulated Rrs(λ) and (b) spectra shape for the two sites.
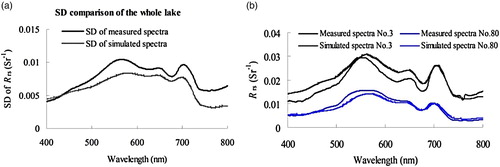
Fig. 4 Comparison of the peak magnitudes between the simulated Rrs(λ) and measured Rrs(λ) (left: first peak around 560 nm; right: second peak around 700 nm). The triangles indicate the simulated values; the dashed-dotted lines show y = x, and the solid lines show the actual relationship between the simulated and measured values.
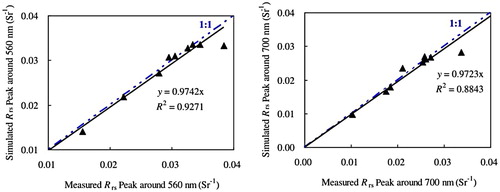
Fig. 5 Comparison of the peak positions between the simulated Rrs(λ) and measured Rrs(λ) (left: first peak around 560 nm; right: second peak around 700 nm). The triangles indicate the simulated values; the dashed-dotted lines show y = x, and the solid lines show the actual relationship between the simulated and measured values.
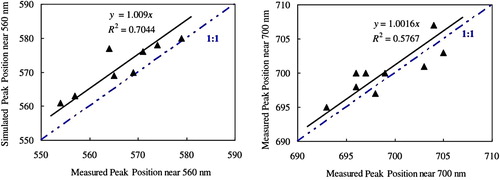
Table 2. Detailed description of the simulated and measured Rrs(λ) at the nine selected sites.
Fig. 6 (a) Rrs spectra measured at several typical sites with (a) different water depths (1.4, 1.5, 1.7, and 1.9 m) and (b) different SDD transparency (SDD = 0.7, 0.9, 1.375, and 1.75 m).
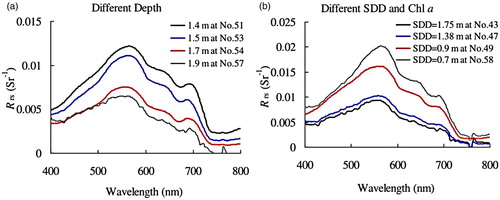
Fig. 7 (a) Rrs spectra measured at three typical sites with different aquatic plant heights under the water surface (0.6, 1.0, and 1.5 m from the surface to the aquatic plant top). (b) Rrs spectra measured at three typical sites with different percentages of aquatic plant cover on the water surface (15%, 60%, and 80% cover).
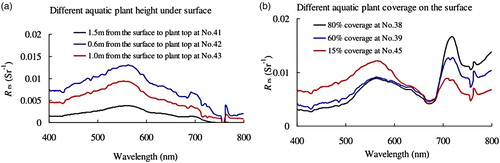
Fig. 8 Measured Rrs spectra (left) and simulated Rrs spectra (right) in the OSWs of Lake Taihu.
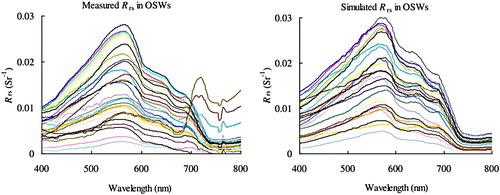
Fig. 9 Comparison of the simulated and measured Rrs (upper left) at sites No. 39 and No. 45 (two typical sites with different aquatic plant leaf cover floating on the surface) and the contribution rate estimate at the two sites from 400 to 750 nm (upper right) and magnified in the range of 400 to 700 nm (bottom right).
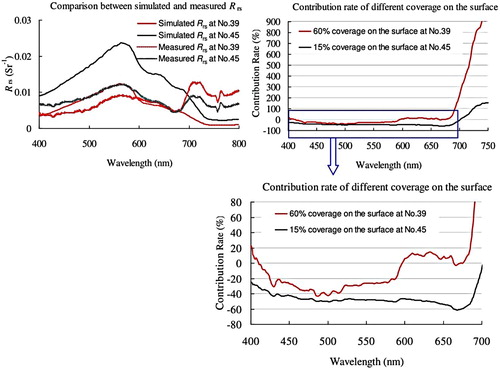
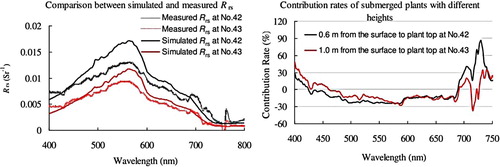
Fig. 10 Comparison of the simulated and measured Rrs (left) at sites No. 42 and No. 43 (two typical sites with different heights of submerged plants) and the contribution rate estimate at the two sites from 400 to 750 nm.