Figures & data
Table 1. Chronology of changes to the configuration of CaPA.
Fig. 1 24 h precipitation total valid at 18 August 2017 1200 utc for (a) CaPA–RDPA and (b) CaPA–HRDPA.
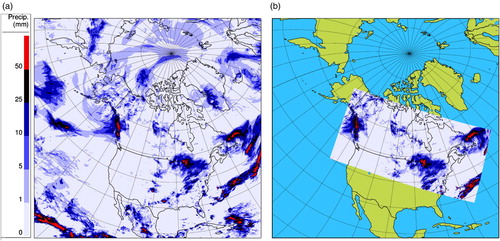
Fig. 2 Enlargement of the Great Lakes region for 24 h precipitation total valid at 18 August 2017 1200 utc for (a) CaPA–RDPA, (b) CaPA–HRDPA, and (c) in situ and radar observations.
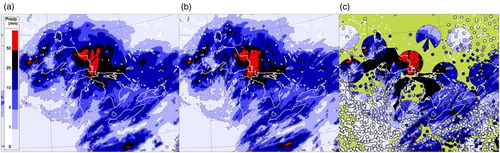
Fig. 3 Confidence index (CFIA) for the 24 h precipitation total valid at 18 August 2017 1200 utc generated by CaPA–HRDPA.
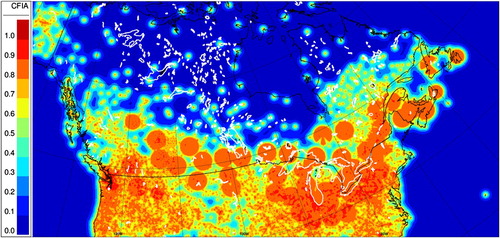
Fig. 4 Datasets used for evaluating the added value of the BC Forest network (purple dots, stations withheld for verification; black dots, stations belonging to the BC Forest network), evaluating the added value of radar data (white circles for the stations, blue circles for the radar footprint), and evaluating the added value of increasing the horizontal resolution of the analysis from 10 km to 2.5 km (red dots). Green dots correspond to the location of the remaining stations assimilated by CaPA.
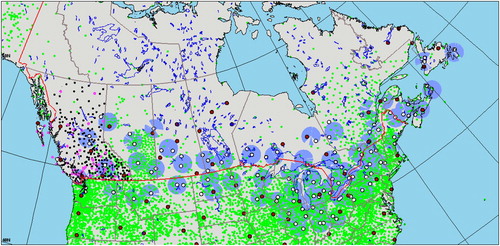
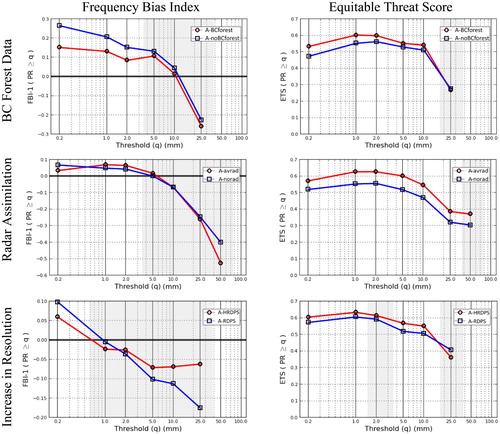
Fig. 5 Impact of three changes to CaPA on the Frequency Bias Index (FBIm, left column) and Equitable Threat Score (ETS, right column) of 24 h analyses for precipitation thresholds between 0.2 and 50 mm per 24 h (x-axis). First row: impact of assimilating BC Forest data, second row: impact of assimilating radar data, third row: impact of increasing horizontal resolution from 10 to 2.5 km. The blue line (with black squares) corresponds to the initial bias and skill before the change, and the red line (with round dots) corresponds to the bias and skill after the change. Differences are not statistically significant where the background of the graph is shaded (90% confidence level). Evaluation performed over the summer of 2017 (June, July, and August). Results are not shown when the number of events for a given threshold is less than 30.