Figures & data
Table 1. A brief description of the datasets used in this study.
Fig. 1 The linear trend in the tropical Pacific SST (°C per century) estimated using the HadISST1 (top panels) and ERSST3 (bottom panels) datasets during the 1908–2000 (left panels) and 1911–2003 (right panels) periods. The numbers at the top right denote the ZSSTG trend. Black boxes in (a) indicate the regions used to define the ZSSTG. Black dots indicate trends that pass the 95% significance test.
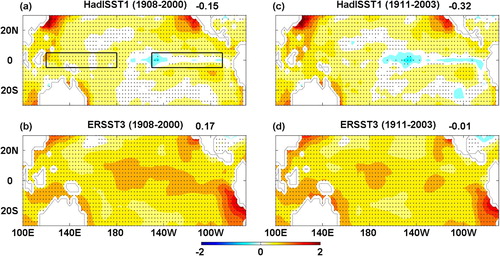
Fig. 2 The ZSSTG trend (°C per century) for different periods estimated using the ERSST3 dataset. The x- and y-axes denote the end year and start year of the period, respectively. Green lines indicate 20-year and 90-year durations, and the red line indicates a 50-year duration. Open black circles indicate the 1908–2000 and 1881–1998 periods. Open orange triangles indicate the 1895–1990 and 1900–2010 periods. The pink and cyan indicate positive and negative values, respectively. The two extreme El Niño events of 1982/83 and 1997/98 are marked.
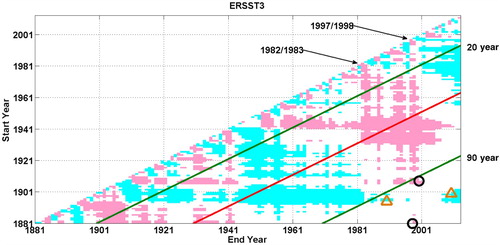
Fig. 3 The ZSSTG trend (°C per century) for different periods since 1881. Colours and lines are as in . The extreme El Niño event of 1997/98 is marked.
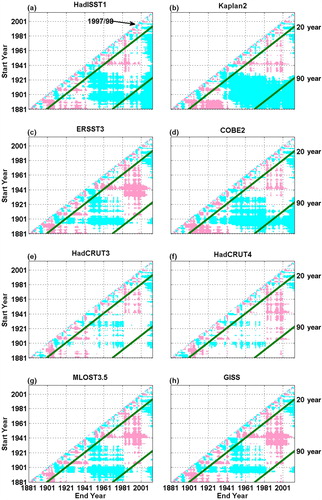
Fig. 4 The multi-dataset average of the ZSSTG trend. The pairs of years with robust trends are shown as dots. Colours and lines are as in . The two extreme El Niño events of 1982/83 and 1997/98 are marked.
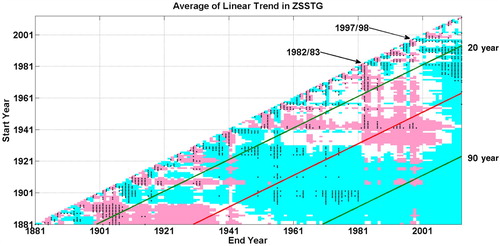
Fig. 5 The normalized 10-year running mean of the ZSSTG (blue line) and the normalized PDO index (red line) for the four interpolated datasets. The number at the top right of each panel is the correlation coefficient.
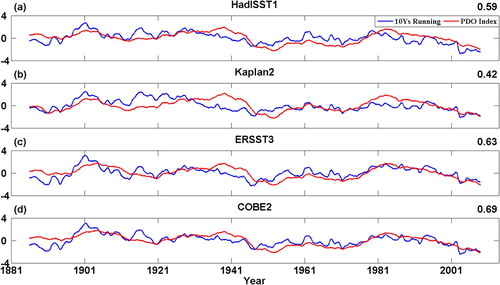
Fig. 6 (a) Evolution of the 50-year multi-dataset–averaged ZSSTG trend (black line) and the multi-dataset average of the PDO indices (red line) estimated using the interpolated datasets. (b) Lead-lag correlation of the two curves shown in (a). Solid blue lines indicate the 95% confidence interval. Negative (positive) numbers denote the 50-year multi-dataset–averaged ZSSTG trend leading (lagging) the PDO index.
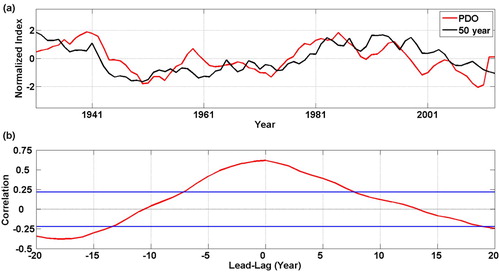
Fig. 7 The 10-year running mean of the ZSSTG for the four interpolated datasets.
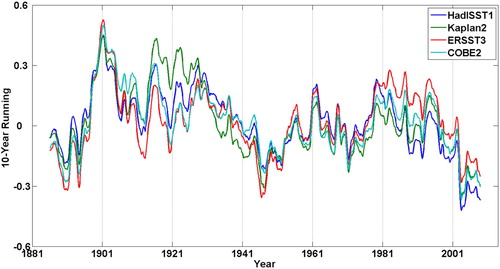
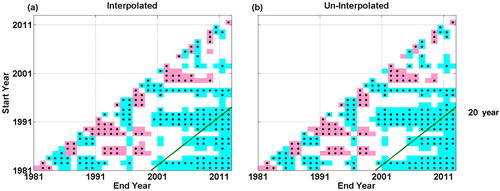
Fig. 8 As in , but for (a) the interpolated datasets and (b) the un-interpolated datasets.
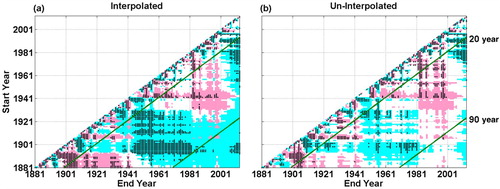
Fig. 9 The percentage of pairs of years that have a robust ZSSTG trend at (a) short-term and (b) long-term time scales as functions of the central longitudes of the western equatorial Pacific and the eastern equatorial Pacific. Red crosses indicate the central longitudes used to define the western equatorial Pacific and the eastern equatorial Pacific in this study.
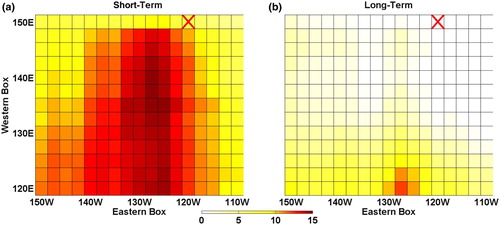
Fig. 10 As in , but for the ZSSTG trend since 1981.
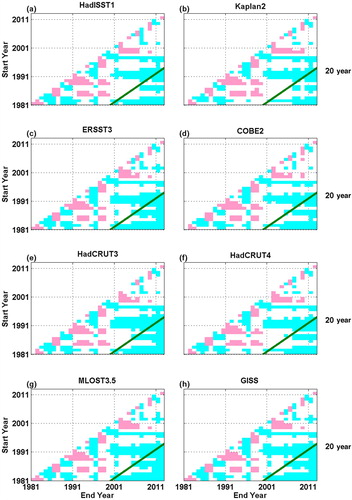
Fig. 11 As in , but for the ZSSTG trend since 1981.