Figures & data
Fig. 1 Location of (a) the Nelson River basin (NRB), Churchill River basin (CRB), and Lower Nelson River basin (LNRB). (b) Major rivers within the LNRB are labelled; black triangles show the selected ECCC stations for this study; red diamonds denote current generating stations; the yellow circle shows a generating station under construction by Manitoba Hydro; the green box represents the Notigi Control Structure; and the red star indicates the Churchill River diversion. (c) Domain elevation distribution and selected sub-watersheds (black line).
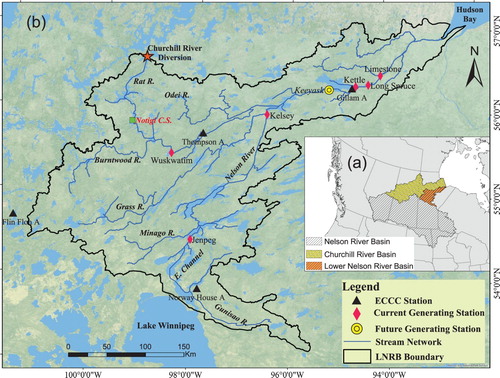
Table 1. Main characteristics of the datasets used in this study.
Fig. 2 Area-averaged annual (a) total precipitation and (b) mean air temperature over the LNRB for the ANUSPLIN, NARR, ERA-Interim, WFDEI, and HydroGFD datasets compared with four ECCC stations average values across the basin, 1981–2010.
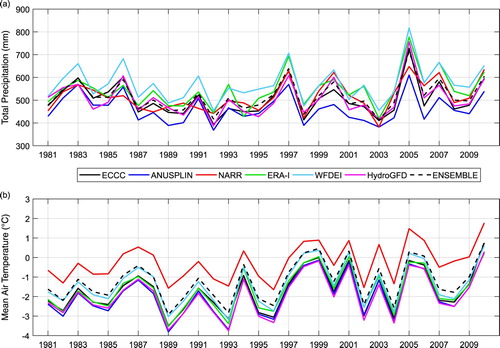
Table 2. Seasonal and annual precipitation and mean air temperature statistics for the domain-averaged ANUSPLIN, NARR, ERA-Interim, WFDEI, HydroGFD, and ENSEMBLE datasets with four ECCC stations average values across the LNRB, 1981–2010.
Fig. 3 Area-averaged climatology of (a) monthly total and (b) monthly mean air temperature over the LNRB for the IDW, ANUSPLIN, NARR, ERA-Interim, WFDEI, HydroGFD, and ENSEMBLE datasets, 1981–2010.
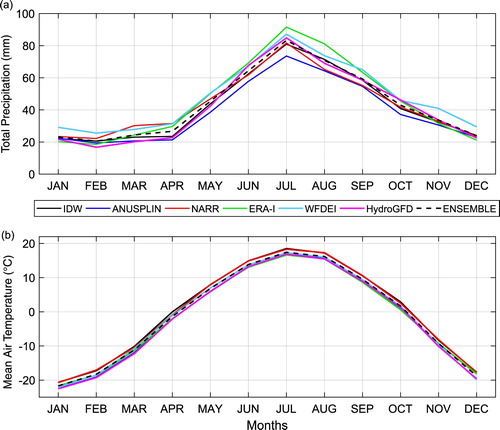
Fig. 4 Spatial distribution of the annual total precipitation (mm mo−1) for the (a) IDW, (b) ANUSPLIN, (c) NARR, (d) ERA-Interim, (e) WFDEI, and (f) HydroGFD datasets, 1981–2010.
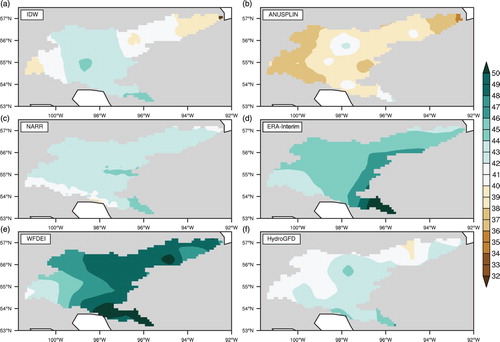
Fig. 5 Ensemble mean and standard deviation of (left) precipitation and (right) mean air temperature, 1981–2010.
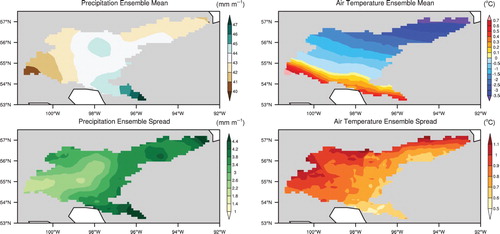
Fig. 6 Spatial distribution of the mean annual air temperature (°C) for the (a) IDW, (b) ANUSPLIN, (c) NARR, (d) ERA-Interim, (e) WFDEI, and (f) HydroGFD datasets, 1981–2010.
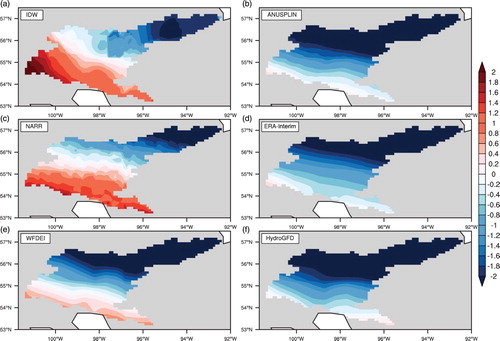
Fig. 7 Spatial trends of the annual total precipitation (mm decade−1) from different datasets, 1981–2010. The grid cells with significant trends (p < 0.05) are indicated by dots.
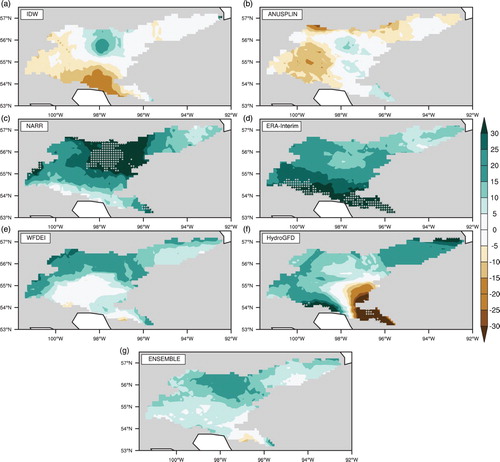
Fig. 8 Seasonal and annual precipitation trends for all datasets and sub-watersheds, 1981–2010: filled circles (annual); DJF (winter) stars; MAM (spring) diamonds; JJA (summer) triangles; SON (autumn) pluses. Red symbols denote significant trends (p < 0.05).
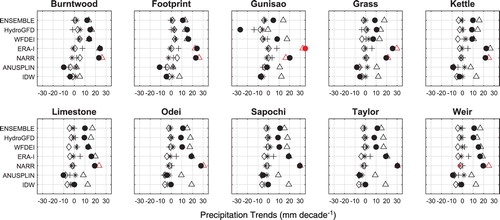
Fig. 9 Spatial trends of the mean annual air temperature (°C decade−1) from different datasets, 1981–2010. Dots indicate grid cells with significant trends (p < 0.05).
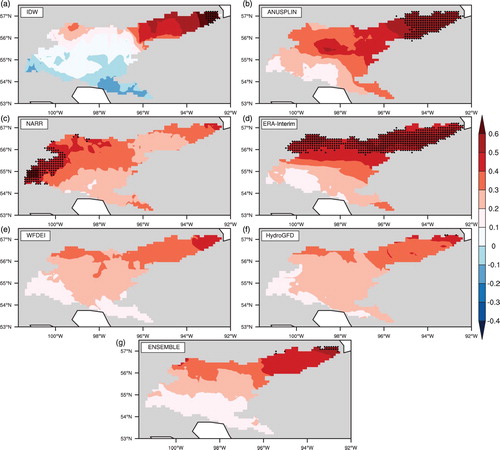
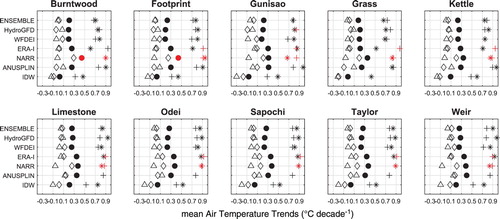
Fig. 10 Seasonal and annual mean air temperature trends for all datasets and sub-watersheds, 1981–2010: filled circles (annual); DJF (winter) stars; MAM (spring) diamonds; JJA (summer) triangles; SON (autumn) pluses. Red symbols denote significant trends (p < 0.05).