
Figures & data
Fig. 1 Study area and the locations of the 11 study sites. Northern sites are denoted by circles; southeastern sites by triangles; and southwestern sites by diamonds. Islands north of the Parry Channel (bounded by red dashed line in the main map) are collectively known as the Queen Elizabeth Islands (QEI).
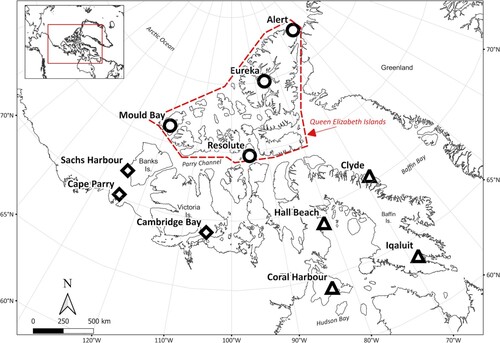
Table 1. Data availability at the study sites.
Fig. 2 Seasonal on-ice (dark circles) and on-land (light triangles) snow depth. m and R2 on the plots refer respectively to the slope and coefficient of determination of on-ice snow depth (red dashed-lines) from September to April, excluding unavailable months. Titles of the plots indicate the sites; the left column contains the four northern sites, the middle column contains the four southeastern sites, and the right column contains the three southwestern sites. Error bars show the standard deviation in snow depth from multiyear measurements in each month.
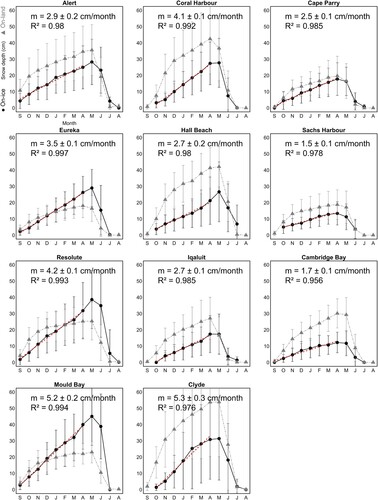
Fig. 3 Interannual variability of on-ice snow depth by season (autumn, winter, and spring) at four sites within the Canadian Arctic. Trends are reported in centimeters per decade. Bold values indicate significance at 95% confidence level.
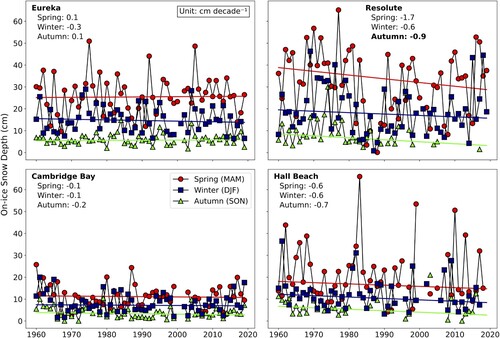
Fig. 4 Interannual variability of on-land snow depth by season (autumn, winter, and spring) at four sites within the Canadian Arctic. Trends are reported in centimeters per decade. Bold values indicate significance at 95% confidence level.
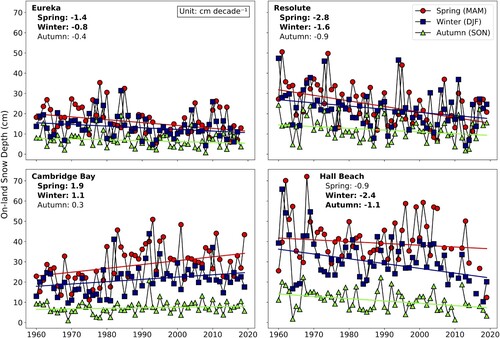
Fig. 5 Difference δHs (cm) between monthly on-land snow depth and monthly on-ice snow depth at the (a) northern; (b) southeastern; and (c) southwestern sites. δHs is calculated by , where
is the on-land snow depth and
is the adjacent on-ice snow depth. Error bars show the multiyear standard deviation of δHs for a calendar month. Note the difference in the vertical scales.
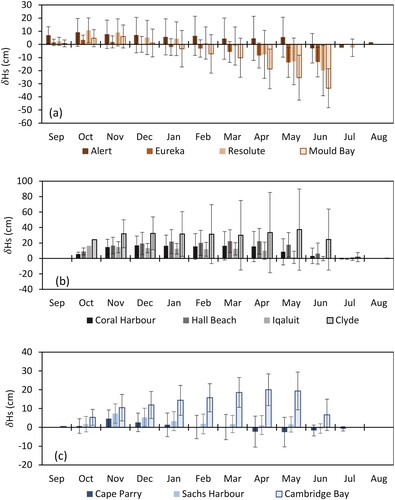
Fig. 6 Monthly snowfall (mm of water equivalent) at the (a) northern; (b) southeastern; and (c) southwestern sites. Error bars show the multiyear standard deviation of snowfall for a calendar month.
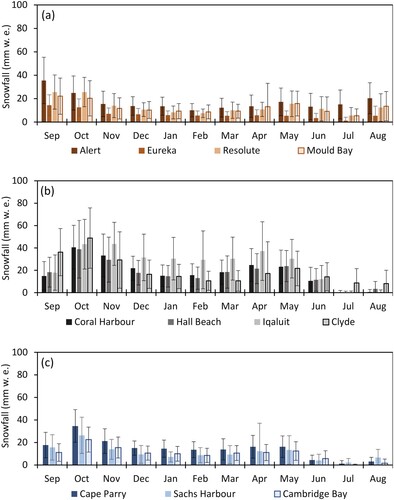
Fig. 7 Monthly rainfall (mm) at the (a) northern; (b) southeastern; and (c) southwestern sites. Error bars show the multiyear standard deviation of rainfall for a calendar month.
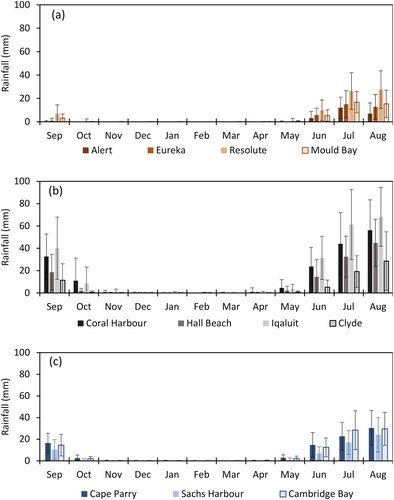
Fig. 8 Interannual variability of snowfall by season (autumn, winter, and spring) at four sites within the Canadian Arctic. Trends are reported in millimetre of water equivalent per decade. Bold values indicate significance at 95% confidence level.
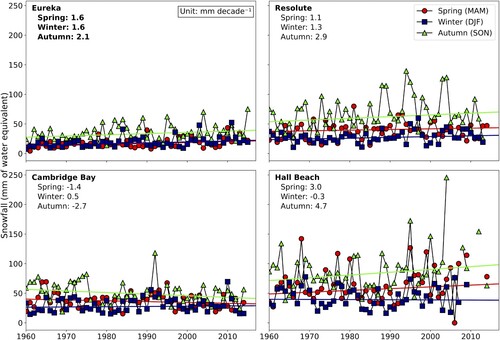
Fig. 9 Interannual variability of rainfall by season (spring, summer and autumn) at four sites within the Canadian Arctic. Trends are reported in millimetre per decade. Bold values indicate significance at 95% confidence level.
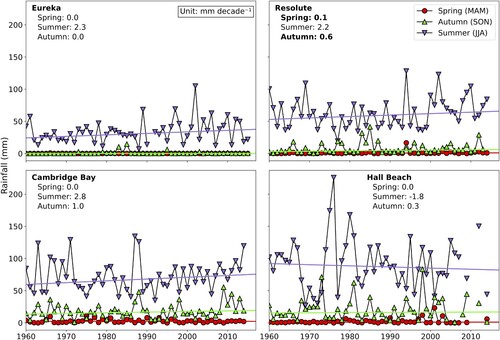
Fig. 10 Monthly mean air temperature (°C) at the (a) northern; (b) southeastern; and (c) southwestern sites. Error bars show the multiyear standard deviation of air temperature for a calendar month. The curves are offset to show vertical error bars of each site and month.
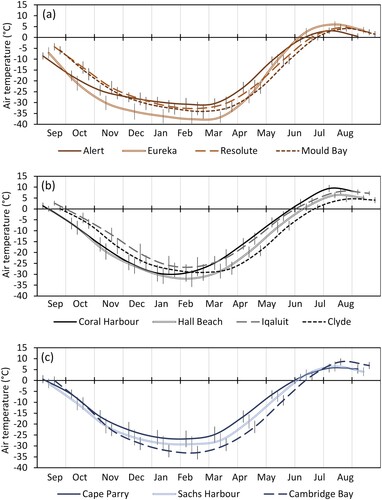
Fig. 11 Interannual variability of air temperature by all four seasons at four sites within the Canadian Arctic. Bold values indicate significance at 95% confidence level.
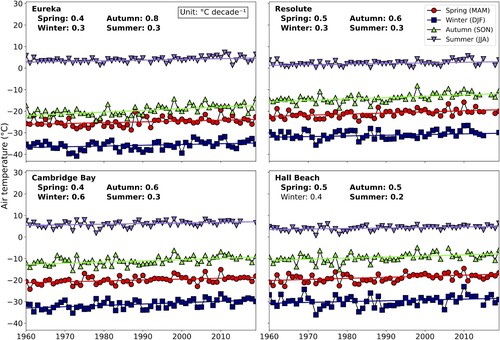
Fig. 12 Length of open water period and the onset of on-land snow accumulation (snow-on) at the study sites. Left (right) end and error bars show the multiyear averages and standard deviations of the day of break-up (freeze-up) rounded to the nearest day. Red circles and capped error bars show the multiyear averages and standard deviations of the day of snow-on. Regions of the sites are denoted by N: northern, SW: southwest, and SE: southeast.
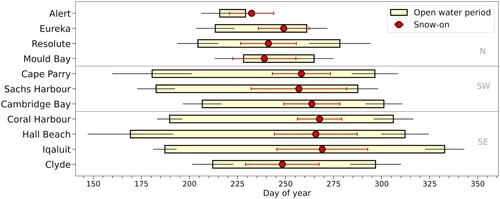
Fig. 13 Interannual variability of sea ice break-up (solid black line), freeze-up (dashed black line) and the length of open water period (vertical bars) at four sites within the Canadian Arctic. Annual onset of on-land snow accumulation (snow-on) is shown by the red circles. Colourbar indicates the length of open water period. Corresponding interannual trends are reported in .
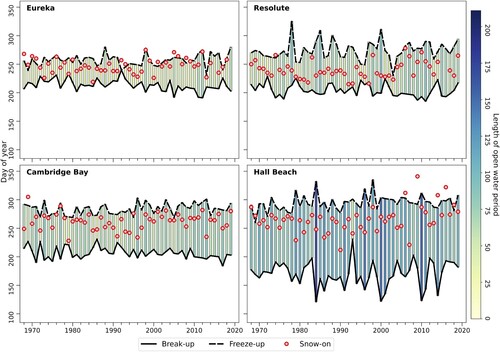
Table 2. Interannual trends (days per decade) of break-up, length of open water period, freeze-up, and onset of on-land snow accumulation (snow-on).
Fig. 14 Total snowfall (mm of water equivalent) within 90 days of freeze-up versus the annual freeze-up. Each circle represents a data pair for a year. Kendall rank correlation coefficients are shown in the text boxes; bold number indicates statistical significance at 95% confidence level. Red line shows the linear trend among the data pairs.
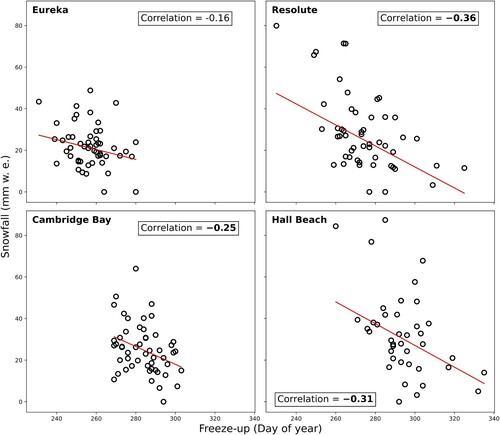
Table 3. Detrended Kendall rank correlation coefficients between snow depths and meteorological variables.
Table 4. Detrended Kendall rank correlation coefficients between on-ice snow depth and on-land snow depth.
Table 5. Detrended Kendall rank correlation coefficients between onsets of snow accumulation and air temperature in autumn.