Figures & data
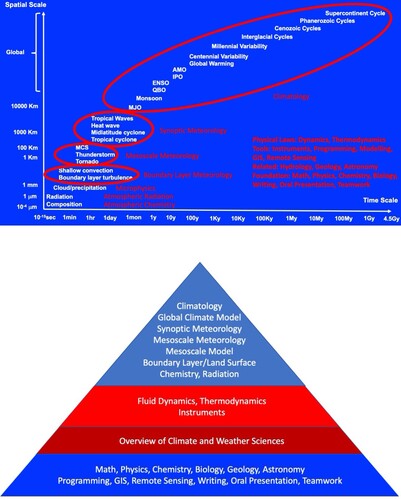
Fig. 1 Earth’s climate and weather: dominant variability and disastrous extremes.
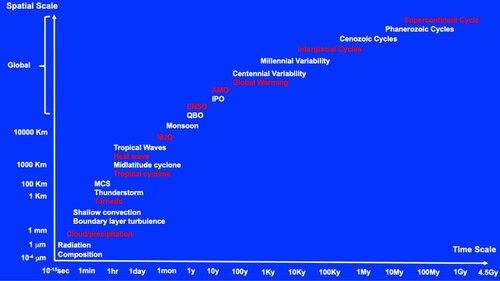
Fig. 2 Schematic of the future global observation system of Earth’s climate and weather.
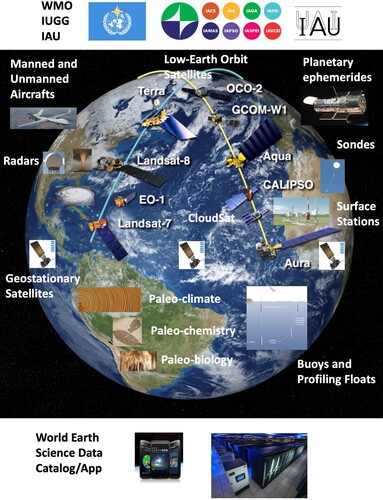
Fig. 3 Current status of the backbone global observation system. (A) Satellite – the European Copernicus Sentinel programme (from NAS Citation2018a). (B) Land surface – Global Land Surface Databank Stations (courtesy of NOAA NCEI). (C) Upper air sounding stations (courtesy of NOAA NWS). (D) Ocean surface – the ICOADS observations for August 2021 (courtesy of NOAA). (E) Deep ocean – the Argo profiling floats for September 28, 2021 (from Argo Programme).
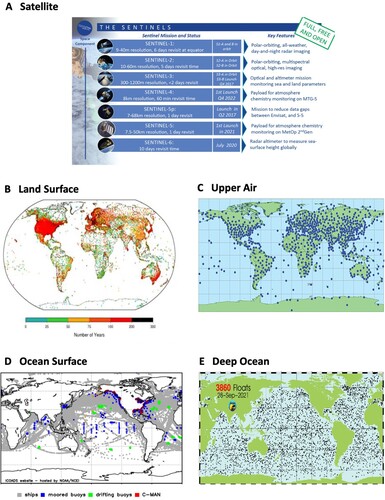
Fig. 4 Current status of the paleoclimate proxy networks. (A) Tree ring (Locosselli et al., Citation2020). (B) Coral (Tierney et al., Citation2015). (C) Speleothem (Comas-Bru et al., Citation2020). (D) Ice core (Jouzel, Citation2013 and the OSU Ice Core Group). (E) Ocean sediment (National Research Council, Citation2011).
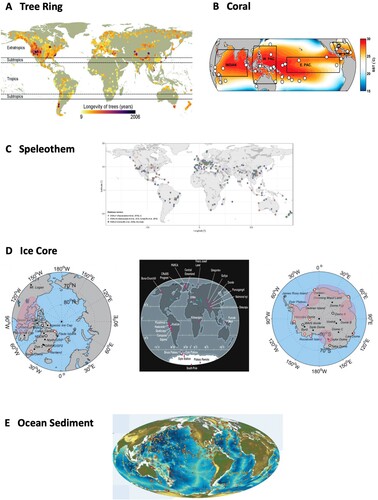
Fig. 5 Schematic of future integrated research on modelling and predictions of Earth’s climate and weather.
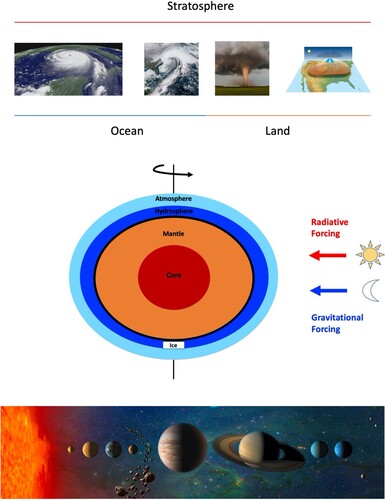
Fig. 6 The expected academic environment.
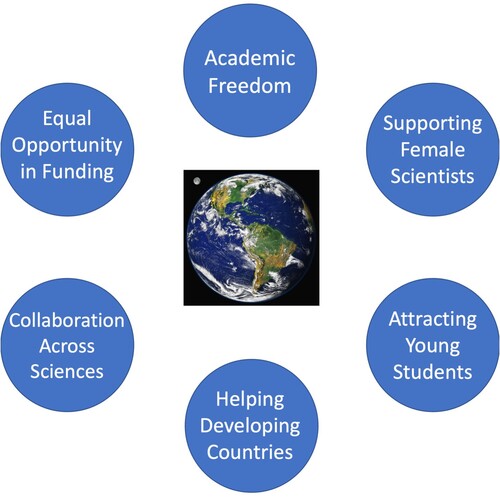
Fig. 7 The education system for young students.