Figures & data
Fig. 1 (A) The geological timescale (adapted from image by Jonathan R. Hendricks. Image in the public domain). (B) History of Earth’s crust and plate tectonics (from Hawkesworth et al., Citation2016). (C) Evolution of life (from Knoll & Nowak, Citation2017).
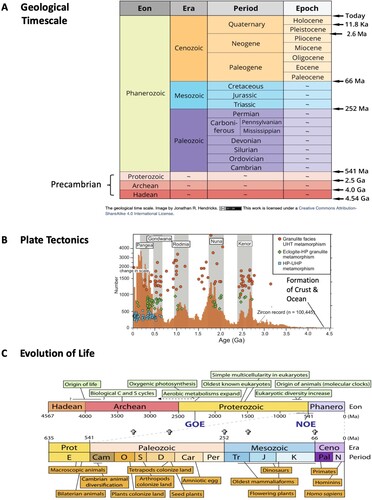
Fig. 2 (Upper) The Earth system with external forcings and internal climate feedbacks. (Lower) Dominant variability and disastrous extremes of Earth’s climate system.
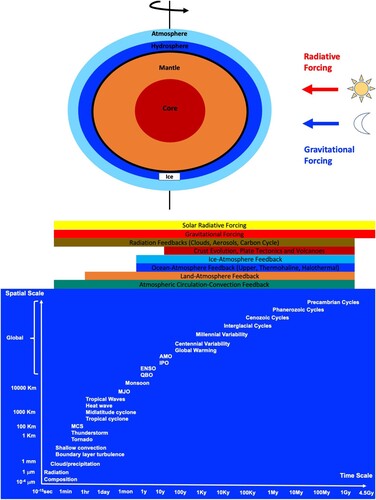
Fig. 3 Estimated relative variance of climate over all periods of variation (from Mitchell, Citation1976).
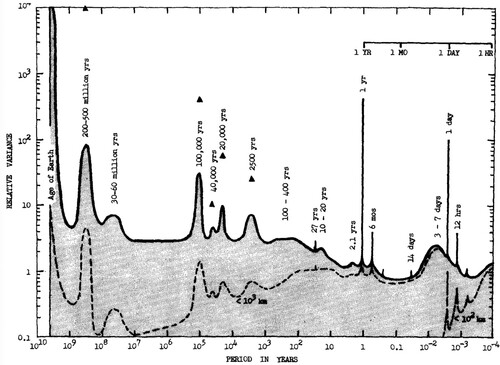
Fig. 4 Observations of Earth’s climate and weather.
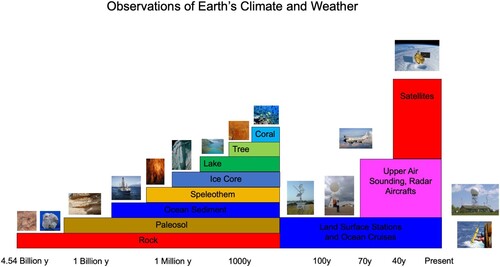
Fig. 5 Temperature records for (A) Precambrian and Phanerozoic (single, used in this study), (B) Quaternary (continuous, used in this study), (C) Holocene (from Kaufman et al., Citation2020), (D) Common Era (from PAGES 2k Consortium, Citation2017), (E) Modern land surface stations (number of years with measurements. Triangles are ARM stations. Adapted from Lawrimore et al., Citation2011), and (F) Modern SST (number of observations between 1880 and 1889, from Woodruff et al., 2011). (G) Modern tidal gauge stations (from Dangendorf et al., Citation2019). (H) Modern CO2 stations with flask (red) and continuous (blue) measurements (from Ciais et al., Citation2014).
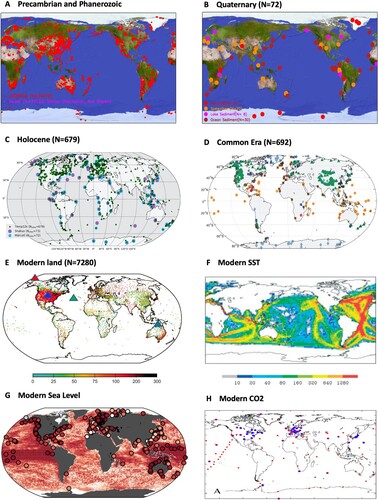
Table 1. Palaeoclimate temperature datasets used in this study.
Table 2. Palaeoclimate sea level and CO2 datasets used in this study.
Table 3. Modern instrument datasets used in this study.
Fig. 6 (A) Precambrian temperature derived from oxygen isotope and silicon isotope in cherts (from Tartèse et al., Citation2017). (B) Phanerozoic temperature derived from marine oxygen isotope (from Veizer & Prokoph, Citation2015). (C) Quaternary SST from the individual (cyan) and stacked (blue) records (from Shakun et al., Citation2015). (D) Late Quaternary temperature from Greenland and Antarctica ice cores (from EPICA Community Members, Citation2006). (E) Common Era northern hemisphere mean surface temperature (from IPCC, Citation2013). (F) Modern global mean surface temperature anomalies (from IPCC, Citation2013).
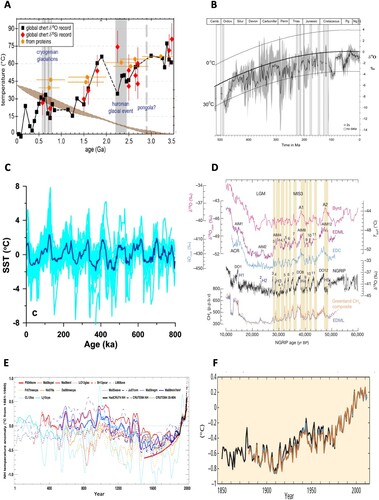
Fig. 7 Earth’s surface temperature history for (A) Precambrian, (B) Phanerozoic, (C) Quaternary, (D) late Quaternary, (E) Holocene, (F) Common Era, (G) 1880–2019, and (H) 2015 (one-minute data from the ARM stations in E).
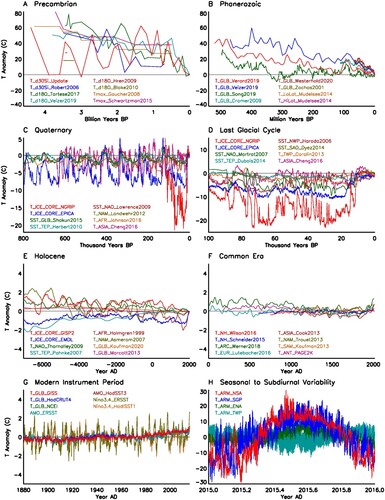
Fig. 8 (A) Physical processes contributing to sea level variation from 1 yr to 100 Ma. SF, sea floor. Cont, continent (from Miller et al., Citation2005). (B) Physical processes contributing to Phanerozoic sea level variation (from Conrad, Citation2013). (C) Phanerozoic sea-level history (from Verard et al., Citation2015). (D) Quaternary sea-level history (from Shakun et al., Citation2015). (E) Late Quaternary sea-level history based on oxygen isotope (line) and coral terraces (black circles) (from Chappell et al., Citation1996). (F) Modern sea level history (from IPCC, Citation2013).
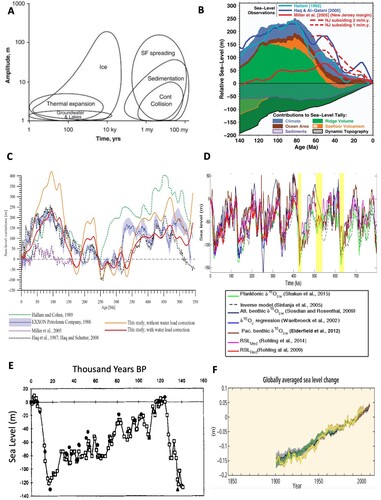
Fig. 9 Holocene sea-level history in different regions from (1) Sparrenbom et al. (Citation2006); (2) Engelhart and Horton (Citation2012), (3) Garcia-Artola et al. (Citation2018); (4) Shugar et al. (Citation2014); (5) Tornqvist et al. (Citation2004); (6) Song et al. (Citation2013); (7) Banjeree (Citation2000); (8) Mann et al. (Citation2019), (9) Angulo et al., 2006; (10) Lewis et al. (Citation2013); (11) Rashid et al. (Citation2014); (12) Garrett et al. (Citation2020); (13) Cooper et al. (Citation2018); (14) Watcham et al. (Citation2011). World map courtesy of NOAA.
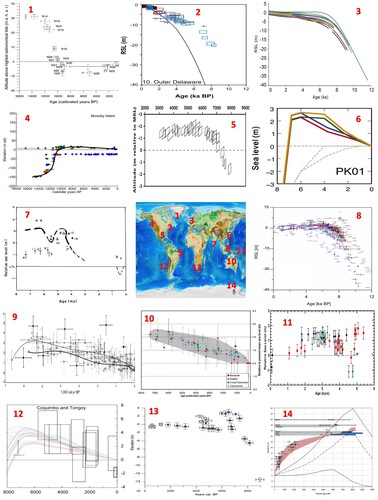
Fig. 10 Earth’s sea-level history for (A) Precambrian, (B) Phanerozoic, (C) Quaternary, (D) late Quaternary, (E) Holocene, (F) Common Era, (G) 1880–2019, and (H) 2017 (hourly data from tidal gauge stations).
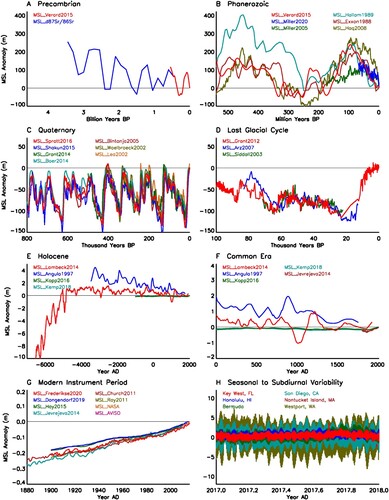
Fig. 11 (A) Precambrian CO2 history from a model (black line, yellow shading indicates its 95% confidence level) and various observations (from Catling & Zahnle, Citation2020). (B) Phanerozoic CO2 history from proxies (from Royer, Citation2014). (C) Quaternary CO2 history from Antarctic ice core composite and temperature from EPICA (from Luthi et al., Citation2008). (D) Late Quaternary CO2 history from Byrd Station, Antarctica together with other climate variables (from Ahn & Brook, Citation2008). (E) Common era CO2 history from ice core measurements in Greenland (symbols) and Antarctica (line) (from Barnola et al., Citation1995). (F) Common era CO2 history from ice core measurements in NEEM, Dome Fuji, Law Dome, WDC, EDML and South Pole (from Oyabu et al., Citation2020). (G) Common era CO2 history from stomata (dots) and ice core (black line) (from Finsinger & Wagner-Cremer, Citation2009). (H) Historical CO2 concentrations used by IPCC AR6 (from Meinshausen et al., Citation2017).
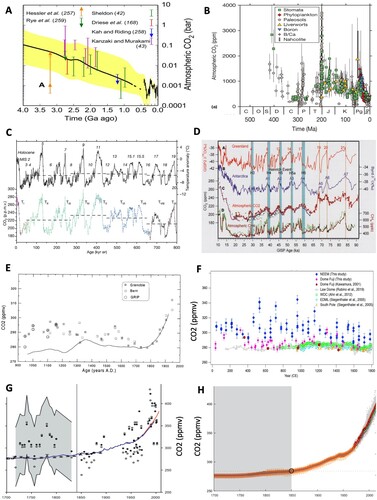
Fig. 12 (A) Annual mean CO2 concentrations measured at Montsouris, France, 1877–1910 (from Stanhill, Citation1982). (B) Monthly mean CO2 concentrations measured at two stations in Scandinavia, 1955–1959 (from Bischof, Citation1960). (C) Zonal-mean CO2 concentration measured by NOAA ESRL (from Jiang et al., Citation2016). (D) Seasonal mean CO2 concentration for JAS 2008 measured by IASI (from Crevoisier et al., Citation2009). (E) Climatological monthly mean CO2 concentration for May measured by AIRS (from Pagano et al., Citation2014). (F) Monthly mean CO2 concentration for May 2015 measured by OCO-2 (from Eldering et al., Citation2017) (G) Monthly mean CO2 concentration for May 2010 measured by GOSAT (from Crisp et al., Citation2012). (H) Annual mean CO2 concentration for 2009 measured by SCIAMACHY (from Schneising et al., Citation2011).
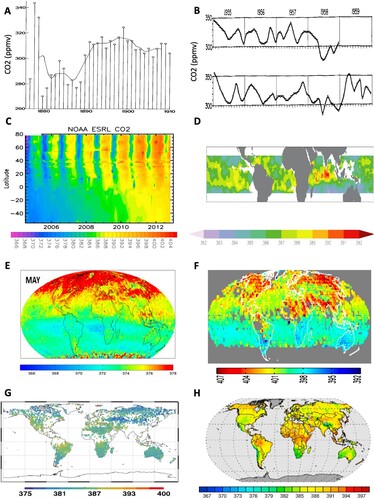
Fig. 13 Earth’s CO2 history for (A) Precambrian, (B) Phanerozoic, (C) Quaternary, (D) late Quaternary, (E) Holocene, (F) Common Era, (G) 1880–2019, and (H) 2010 (continuous 5-minute data from towers).
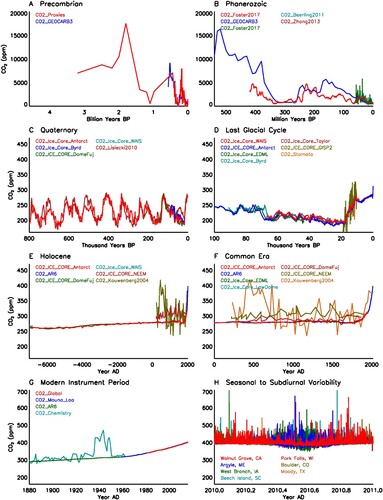
Fig. 14 Summary of the amplitudes of dominant climate variability. The amplitudes of oscillations are estimated using standard deviation multiplied by 2, while that of global warming is simply the increase from 1880 to 2020.
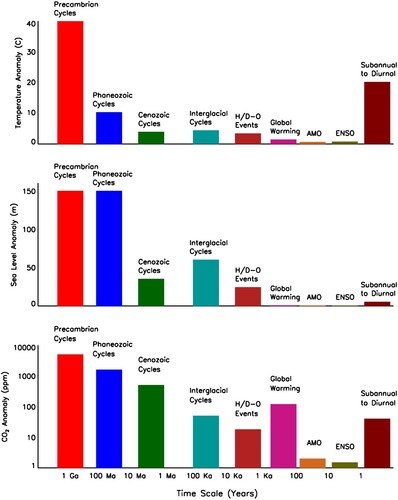
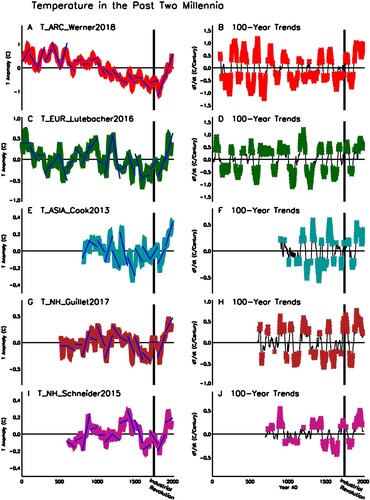
Fig. 15 Regional mean surface temperature in the past 2000 years for (A) Arctic (Werner et al., Citation2018), (C) Europe (Lutebacher et al., Citation2016), (E) Asia (Cook et al., Citation2013), (G) Northern Hemisphere (Guillet et al., Citation2017), and (I) Northern Hemisphere (Schneider et al., Citation2015). Linear trends are shown for 100-year periods ending at 100AD, 200AD, … , 1900AD and last year of data (blue lines). The corresponding 100-year running trends (warming rates) are shown in (B) (D) (F) (H) and (J), respectively. Colour stars denote the linear trends that are above the 95% confidence level.