
Figures & data
Fig. 1 Regions of the Northwest Passage located in the western Canadian Arctic.
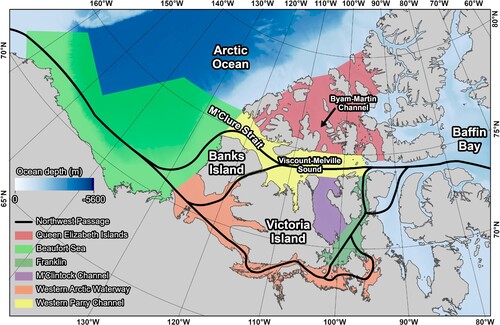
Table 1 Source information for six time periods identified as being significant in the history of the Canadian Ice Service with respect to ice chart preparation.
Table 2 Quality index score for the regions in the western Canadian Arctic regions of the Northwest Passage for the six time periods identified as being significant in the history of the Canadian Ice Service with respect to ice chart preparation.
Fig. 2 Spatial distribution of the average MYI concentration from 25 June to 15 October for 1968–2006 (a), 2007–2020 (b), and (c) the difference of 2007–2020 minus 1968–2006 for the western Canadian Arctic. The extent of Canadian Ice Service ice charts did not fully cover the Arctic Ocean from 1972 to 1996.
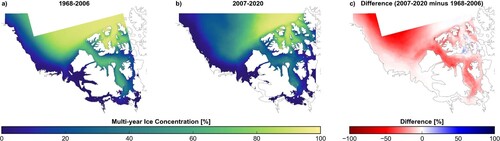
Table 3 Percentage of MYI concentration from 1968 to 2006, 1978 to 2006, and 2007 to 2020 in the regions of the Northwest Passage and percentage change from 1968–2006 to 2007–2020 and 1978–2006 to 2007–2020 with the standard deviation in brackets. These percentages represent the average from 1968 to 2006, 1978 to 2006, and 2007 to 2020 based on each year’s 17-week shipping season average. MYI is scaled by the total area for each region.
Fig. 3 Time series of the percent MYI area difference during the shipping season from the 1991–2020 climatology for the western Canadian Arctic regions of the Northwest Passage from 1968 to 2020. The annotated text corresponds to the average percent MYI difference for the 1968–2006 period (blue) and 2007–2020 period (red). The shipping season is defined as the 17-week time period from 25 June to 15 October.
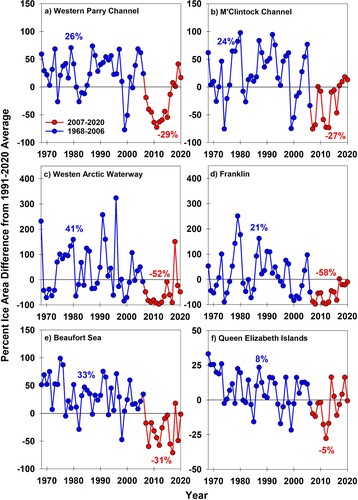
Fig. 4 Time series of changes in MYI recovery and loss components (%) for the western Canadian Arctic regions of the Northwest Passage from 1968 to 2020. The pink dashed line marks the cutoff between our focus periods in 1968–2006 and 2007–2020. MYI is scaled by the total area for each region.
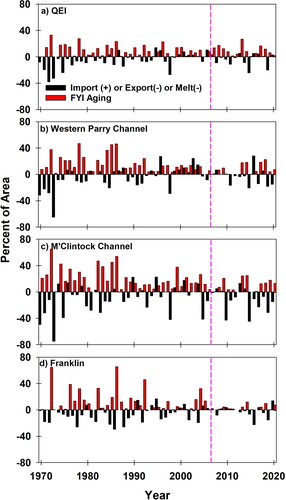
Table 4 Percentage of MYI dynamic exchange and FYI aging from 1968 to 2006, 1978 to 2006, and 2007 to 2020 in the regions of the Northwest Passage with the standard deviation in brackets. These percentages represent the average from 1968 to 2006, 1978 to 2006, and 2007 to 2020. MYI is scaled by the total area for each region.
Fig. 5 Spatial distribution of MYI concentration on the first Canadian Ice Service ice chart in October from 1982 to 1987. Note the severing before 1984 then reestablishment of the MYI tongue connecting the Beaufort Sea to the Western Parry Channel in subsequent years.
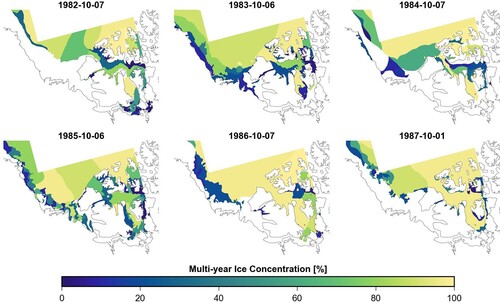
Fig. 6 Spatial distribution of MYI concentration on the first Canadian Ice Service ice chart in October from 1999 to 2004.
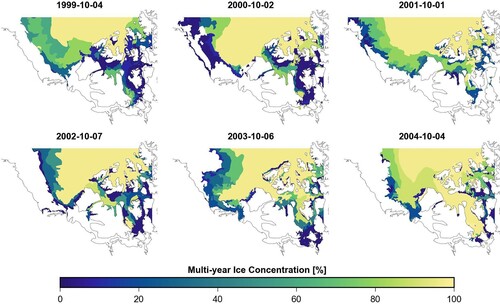
Fig. 7 Spatial distribution of MYI concentration on the first Canadian Ice Service ice chart in October from 2007 to 2020.
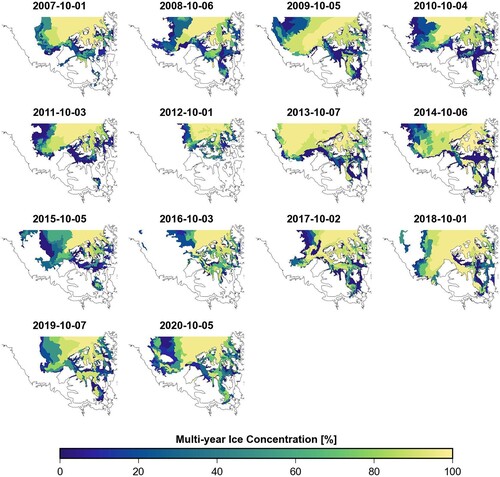
Fig. 8 Weekly evolution of MYI area in the M’Clintock Channel for (a) 1982–1986, (b) 2001–2004, (c) 2007–2011, and (d) 2016–2020. The vertical dashed line indicates the date (1 October) when FYI is promoted to MYI.
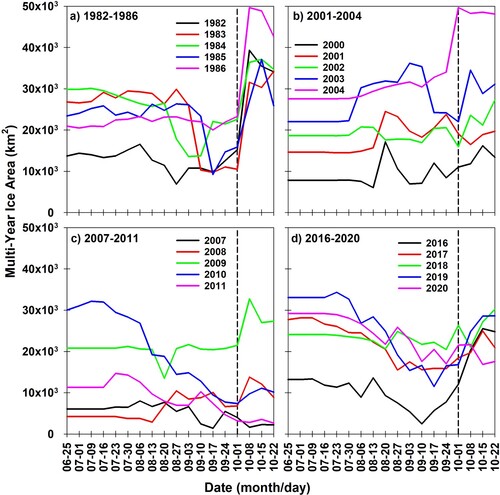
Fig. 9 Time series of the surface (a) skin temperature and (b) albedo anomalies during the shipping season in the western Canadian Arctic regions of the Northwest Passage from 1982 to 2020. The pink dashed line marks the cutoff between our focus periods in 1982–2006 and 2007–2020.
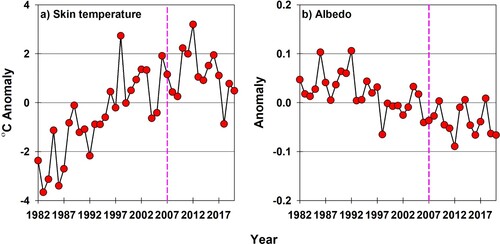
Table 5 Linear slope of shipping season average surface skin temperature and albedo over the period of 1982–2020 in the regions of the Northwest Passage. All trends are significant at the 95% confidence level.
Table 6 De-trended correlations between average shipping season surface skin temperature and FYI aging and between average June to October albedo and FYI aging over the period of 1982–2020 in the regions of the Northwest Passage. Correlations are significant at the 95% confidence level as in bold.