Figures & data
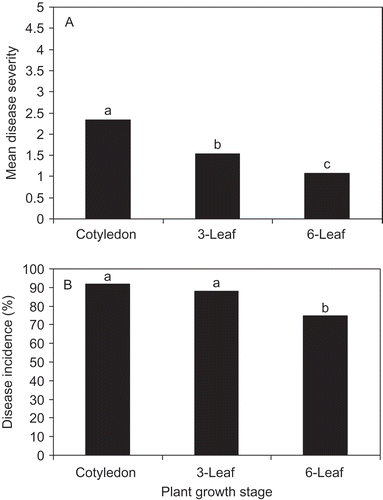
Fig. 1. Mean disease severity (a) and disease incidence (b) for the plants infected at 1, 0 (cotyledon), 1, 3 (3-leaf) and 1, 6 (6-leaf) stages of cultivar ‘Westar’. The experiment was carried out in a 50 × 60 m plot from June 1st to July 7th in 2004 for five weeks and from May 27th to August 10th in 2005 for 10 weeks at the Carman Research Station, Carman, Manitoba. Ten plants at 1, 0; 1, 3; and 1, 6 stages were each placed in a phoma stem canker-infested canola field for one week. After one week of field exposure, the plants were returned to greenhouse until the pod-filling stage. Stem disease severity was evaluated using a 0-5 scale where 0 = uninfected, 1 = lesion area less than 25% of the cross-section area of the crown, 2 = 25 to 50%, 3 = >50% girdled, stem firm, 4 => 50% girdled, stem weak, and 5 = plant dead (West et al., Citation2002). The square root transformation was applied to mean disease severity.