Figures & data
Fig. 1. Clusters of bananas divided into two parts through the transverse cutting of the crown for the visualization of internal crown rot symptoms that was adjusted to a rectangular shape for measurements of the necrotic surface.
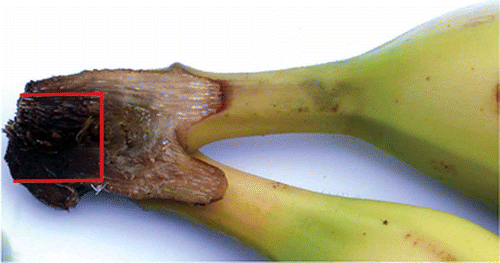
Fig. 2. Representation of different means of INS versus their confidence intervals at 95% assessed in two experiments differing by their post-inoculation environmental conditions in (a) Dia-dia, (b) Koumba and (c) Ekona. In experiment 1 (Black ![]()
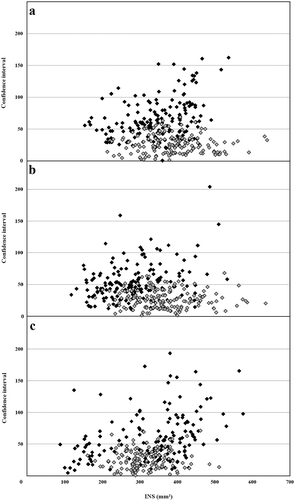
Fig. 3. Time course of the variation of internal necrotic surface (INS) in Dia-dia (——) and Koumba (-- -- -- --). Each point represents the average mean of three replicates for each location (for each repetition INS was assessed over 15 fruits). Error bars represent standard deviation.
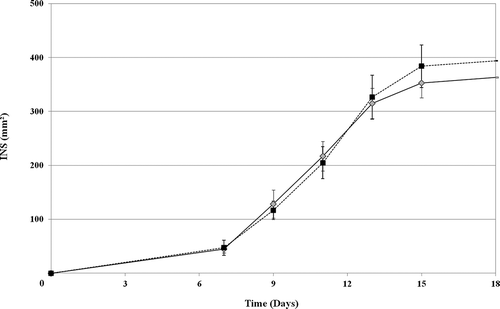
Table 1. Variance analysis of geographical and seasonal effects on banana susceptibility to crown rot
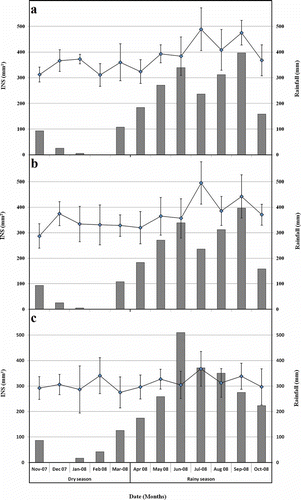
Fig. 4. Seasonal variation of the internal necrotic surface (INS —