Figures & data
Table 1. Fungal isolates used in this study
Fig. 1. (Colour online) Colony morphology and growth rates of the wild-type strain XJZ2 and the T-DNA insertional mutant W2987. Strains XJZ2 and W2987 were grown on PDA plates at 25 °C and colony diameters were measured every 24 h. (A) Colony morphology recorded at the fourth day after inoculation. (B) Colony growth rates of XJZ2 and W2987 within five days after plating.
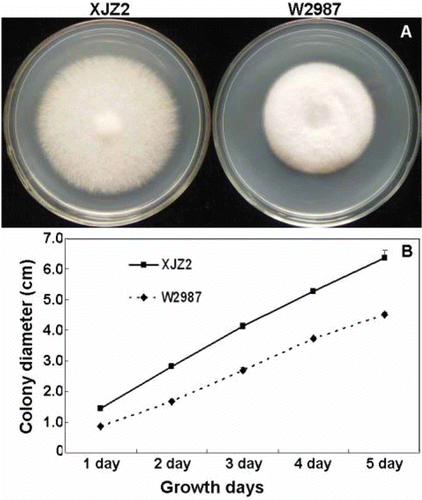
Fig. 2. Conidial production of the wild-type strain XJZ2 and the T-DNA insertional mutant W2987. Strains XJZ2 and W2987 were cultured on PDA medium. After seven days of growth, conidia were harvested by flooding the PDA plates with 20 mL of 0.05% Tween 20 and quantified under a microscope with the aid of a haemocytometer. Difference in conidial production between XJZ2 and W2987 is significant (** at P<0.01).
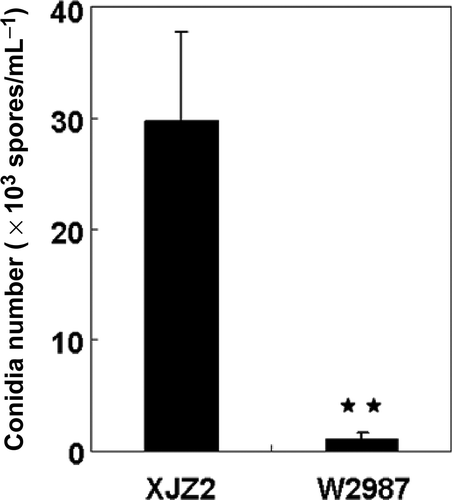
Fig. 3. (Colour online) Pathogenicity tests of the wild-type strain XJZ2 and the T-DNA insertional mutant W2987. (A) Disease symptom (discolouration) observed in the corms of the banana plantlets at 30 days post-inoculation. Banana plantlets inoculated with water were used as negative control (CK). (B) Disease severity of XJZ2, W2987 and CK based on disease index. Difference in virulence between XJZ2 and W2987 is significant (** at P < 0.01).
Fig. 4. (Colour online) Southern blot analysis of F. oxysporum f. sp. cubense T-DNA insertional mutants. T-DNA insertional mutants (X724, W2987, X1071, B1233, L953, 865) and wild-type strain XJZ2 were cultured in YPD medium at 25 °C for three days, mycelia and conidia were collected for DNA extraction. Genomic DNA was digested by HindIII overnight, separated in a 0.8% agarose gel, blotted onto a N+ nylon membrane, and was hybridized with the Dig-labelled DNA fragment amplified from the hygromycin B phosphotransferase (HYG) gene.
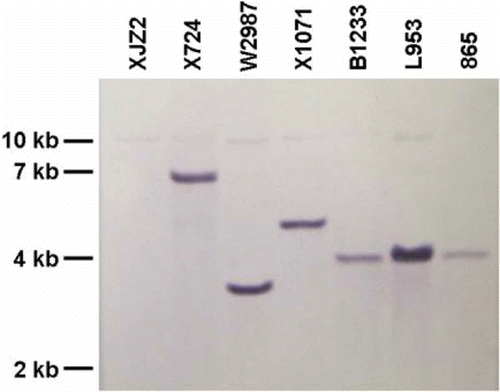
Fig. 5. T-DNA insertional site and its target gene structure in the mutant W2987 of F. oxysporum f. sp. cubense. The predicted gene 1 contains an open reading frame (ORF) with four exons (dark) separated by three introns (interval between exons). Gene 2 contains no intron. The T-DNA was inserted at 473 bp downstream of the gene 1 ORF and at 1227 bp upstream of gene 2 ORF. Short arrows indicate the primers used in the study. The specific primer set W2987 F / W2987 R for identification of F. oxysporum f. sp. cubense tropical race 4 was designed from the 3′ untranslated region (UTR) of the target gene (gene 1).
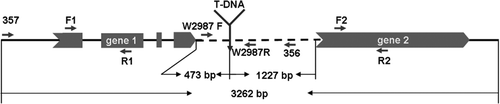
Fig. 6. Quantitative real-time PCR analysis of relative expression of the target genes (gene 1 and gene 2) in the wild-type strain XJZ2 and the T-DNA insertional mutants W2987 and X724. RNAs of XJZ2, W2987 and X724 were purified and the first strand of cDNA was reverse transcribed by the M-MLV reverse transcriptase. Gene 1 and 2 were amplified by the primer sets F1/R1 and F2/R2 (as shown in Fig. 5), respectively. The translation elongation factor gene used as control was amplified by primer set EF1α-1/EF1α-2.
Fig. 7. Phylogenetic tree of the target gene sequences from different Fusarium isolates. Nucleic acid sequences were aligned using ClustalX version 1.8 and then analysed by neighbour-joining method in MEGA version 5.1. Bootstrap values were expressed as a percentage of 1000 replicates. Sequences of XJZ2, XJZ10, FJZ3, FJZ5, BW4, BW1, R2 and R3 (shown in Table 1) were amplified by PCR using primers 356 and 357 shown in Fig. 4. Sequences of FOL (Fusarium oxysporum f. sp. lycopersici 4287, AAXH01000172.1), FO5176 (Fusarium oxysporum 5176, AFQF01001061.1), GM (Gibberella moniliformis 7600, AAIM02000021.1) and GZ (Gibberella zeae PH-1, AACM02000260.1) were downloaded from the GenBank database. Genetic distances between XJZ2 and other fungal isolates are shown on the top of the phylogenetic tree.
Fig. 8. Partial sequences of the 3′ untranslated region (UTR) region of target gene used for design of the primers specific for identification of Fusarium oxysporum f. sp. cubense tropical race 4. Sequences of the fungal isolates were aligned by ClustalX version 1.8. ‘.’ indicates the same nucleotide as one in the isolate XJZ2 and ‘-’ indicates no nucleotide corresponding to the one in the isolate XJZ2. The full-length target DNA sequences are provided in supplementary Fig. S1.
Fig. 9. Agarose gel analysis of PCR products amplified by the specific primer set (W2987 F/W2987 R) from Fusarium oxysporum f. sp. cubense (FOC) tropical race 4 (TR4). A 452-bp PCR fragment was only amplified from the FOC TR4 isolates, but not from non-TR4 isolates. The fragment of the translation elongation factor gene was amplified as a positive control by using primer set EF1α -1/EF1α -2.
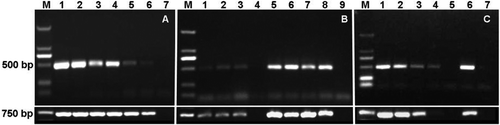
Fig. 10. PCR detection of Fusarium oxysporum f. sp. cubense (FOC) tropical race 4 (TR4) from various samples using specific primer set W2987 F / W2987 R. (A) Sensitivity tests using serial dilutions of DNA from isolate XJZ2 (FOC TR4) as templates. Lane M, marker; lanes 1–6, template DNA with a concentration at 100, 10, 1, 0.1 0.01 0.001 ng μL−1, respectively; lane 7, ddH2O. (B) PCR amplification using DNA isolated from diseased banana tissue as templates. Lane M, marker; lanes 1–3, different DNA samples from diseased banana plant tissues; lane 4, DNA from healthy banana tissue; lanes 5–7, pathogen DNA isolated from diseased banana tissue; lane 8, positive control; lane 9, ddH2O. (C) PCR amplification using DNA isolated from soil samples mixed with different amount of spores of isolate XJZ2 as templates. Lane M, marker; lanes 1–4, DNA isolated from soil samples mixed with 1×10⁵, 1×10⁴, 1×10³, 1×10² and 0 spores mL−1, respectively; lane 6, positive control (XJZ2); lane 7, ddH2O.