Figures & data
Fig. 1 (Colour online) Geographical distribution of the visual survey locations for peach yellows disease in Shaanxi. The symbol (+) indicates where the disease occurred and (-) for the negative locations.
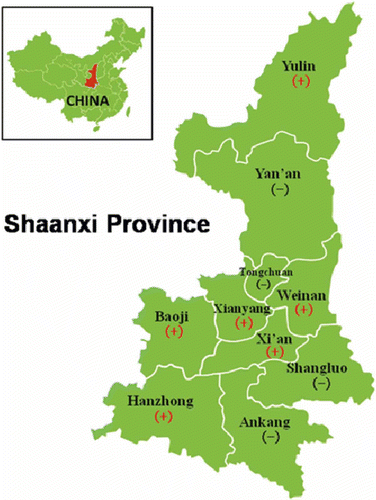
Fig. 2 Symptoms in peach trees infected with phytoplasmas. The diseased peach trees exhibited yellows and dieback (A, B), small and wilted fruit (C) and tattered appearance of leaves (D).
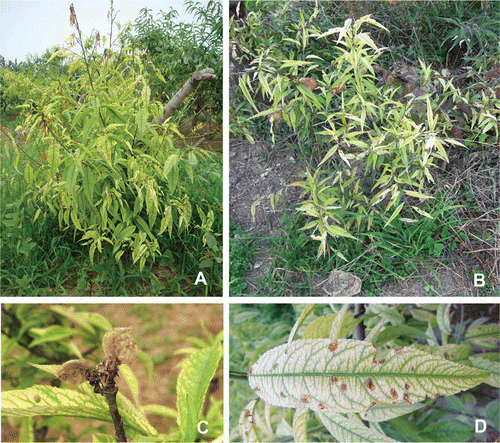
Table 1. 16SrRNA gene sequences of phytoplasmas used for the phylogenetic analysis.
Table 2. Results of nested PCR detection for phytoplasma in peach.
Table 3. Identities between the nine sequences determined in this study and its homogeneous sequences.
Fig. 3 Transmission electron micrographs of an ultrathin section from a symptomatic sample (A) and a healthy sample (B). The black arrows indicate some phytoplasma bodies.
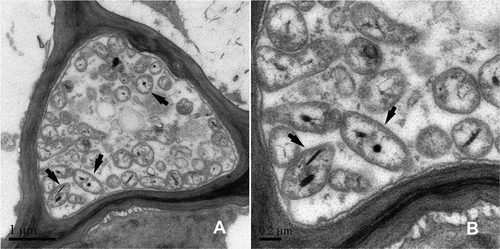
Fig. 4 Phylogenetic tree inferred from the 49 16S rRNA gene sequences of phytoplasmas using MEGA5. Acholeplasma laidlawii was used as an out-group reference.
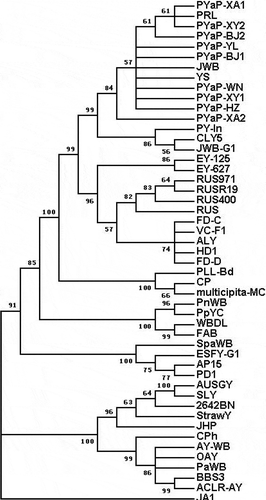
Fig. 5 Separation of nested PCR products after digesting with enzymes. Lanes 1–21, PYaP. Lane 22, graft-transmitted PYaP. Lane 23, JWB. Lanes 24, CWB. Lane 25, MD. Lane M, DNA marker ΦX174 HaeIII digest DNA ladder; band sizes from top to bottom are 1353, 1078, 872, 603, 310, 281, 271, 234, 194 and 118 bp.
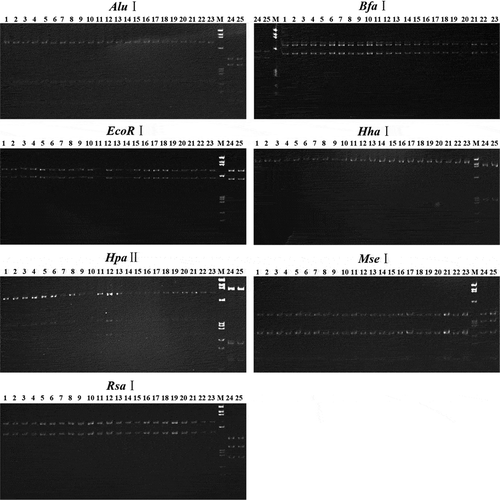
Fig. 6 The virtual gel image of computer-based RFLP analysis showing the distinct band profiles between peach yellows phytoplasma in Shaanxi and representatives of group 16SrV.
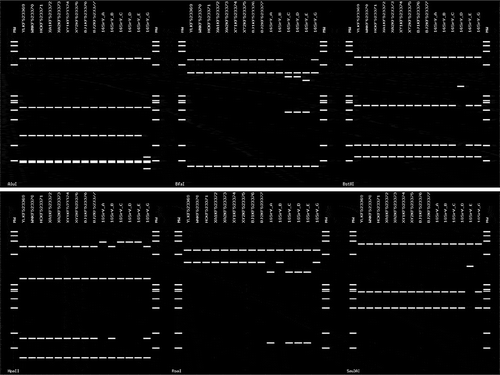
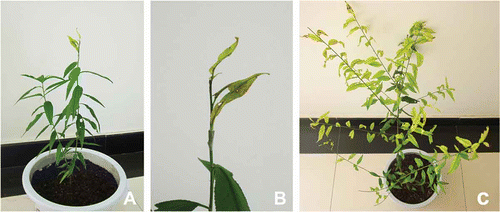
Fig. 7 (Colour online) The bud graft test for the peach yellows phytoplasmas in young peach trees. (A) Young peach tree just after grafting in July 2010; (B) Higher magnification of the grafting site. (C) Grafted peach tree with symptoms of yellows in July 2011.