Figures & data
Fig. 1 (Colour online) PCR analysis and expression of green fluorescent protein from transformants of Fof. (a) M: DNA marker Trans 2K plus; P: Plasmid; WT: Fof wild type; 1–16: Fof transformants. (b) GFP expression in mycelium of transformants. (c) GFP expression in conidia of transformants. (d) No GFP expression observed in mycelia and conidia from wild-type Fof. Scale bars: b, c, d = 10 μm.
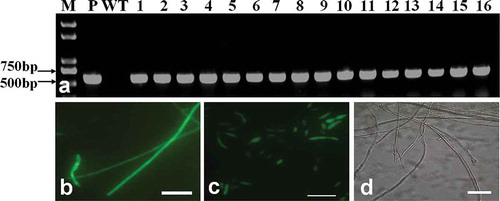
Fig. 2 (Colour online) Morphology and green fluorescent protein expression of selected Fof transformants. (a) Left: Fof wild type with 5 days after inoculation on PDA; Right: transformant with 5 days after inoculation on PDA containing 70 mg L−1 hygromycin B. (b) GFP expression in hyphae of transformants after subculturing 5 times. Scale bars: a = 1 cm; b = 10 μm.
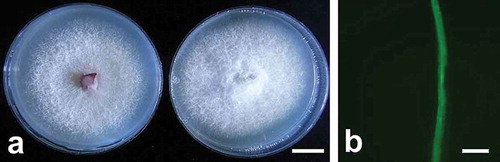
Fig. 3 (Colour online) Early stages of the colonization of strawberry roots by GFP labelled Fof isolate. (a) Spore attached to the root surface (arrow) 24 h after inoculation. (b) Germinated conidia on the root surface with the emergence of a germ tube (arrows) 36 h after inoculation. (c) A conidium infecting the root through junctions of epidermal cells (arrow) 36 h after inoculation. (d) Hyphal growth along the junctions of epidermal cells (arrow) 48 h after inoculation. (e) Spore attached to root hair (arrow) 24 h after inoculation. (f) Hyphae are attached to the root tip via suction cup-like structures (arrow) 48 h after inoculation. (g) Colonization on the root tip surface by hyphae growths that are forming a complex network 3 days after inoculation. (h) Hyphae network formed on the root elongation surface 4 days after inoculation. Scale bars: a = 100 μm; b–h = 10 μm.
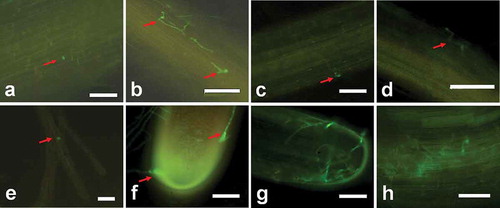
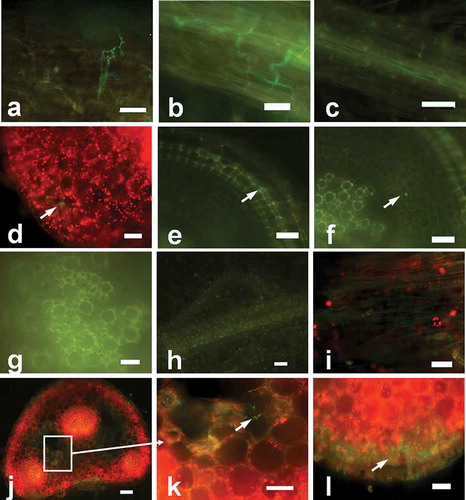
Fig. 4 (Colour online) Advanced stages of infection and colonization of strawberry roots and petioles by Fof isolate marked with GFP. (a) Hyphae were swollen inside the epidermal tissues 5 days after inoculation. (b) Hyphae forming an expanding network inside epidermal tissues 6 days after inoculation. (c) Intra- and inter-cellular spreading of hyphae in epidermis tissues 6 days after inoculation. (d) Intercellular growth of hyphae in the cortex (arrows) and cross-section of the primary root (arrow) 6 days after inoculation. (e) Spread of hyphae in epidermal tissues (arrow) in a cross-section of the primary root 12 days after inoculation. (f) Spread of hyphae in cortical tissues (arrow) in the cross-section of the primary root 12 days after inoculation. (g) No hyphae in vascular tissues seen in the cross-section of the primary root 12 days after inoculation. (h) No hyphae on the surface of the root tips 12 days after inoculation. Auto-fluorescence of the dead root can be seen. (i) Spread of hyphae in intra- and inter-cellular epidermal tissues of petioles 12 days after inoculation. (j, k, l) Intracellular growth of the pathogen (arrow) in the cortical tissues, intercellular (arrows) area of the epidermal cell layers, and cross-section of petiole 12 days after inoculation. Scale bars: a–l = 10 μm.