
Figures & data
Table 1. Primers for loop-mediated isothermal amplification designed from ITS region of Rhizoctonia solani.
Table 2. Measurement of turbidity of LAMP products with a spectrophotometer.
Fig. 1 Schematic diagram of ITS (ITS1 and 5.8 s rRNA) sequence of Rhizoctonia solani showing location of LAMP primers.
Fig. 2 (Colour online) Schematic illustration of chromatographic loop-mediated isothermal amplification combined with lateral flow devices (LAMP-LFD). Using biotin-labelled primers, LAMP amplicons are labelled with biotin and then hybridized to a target-specific ssDNA probe labelled with a fluorescein-containing label, in this case fluorescein amidite. When loaded on the LFD device, these amplicons capture coloured latex beads coated with anti-biotin antibodies. These latex beads/LAMP complexes, when passing through the LFD device, are selectively captured and enriched by anti-fluorescein antibody at the test line ‘T’ showing a strong colour, in this case blue. Unbound excess latex beads/anti-biotin antibody complexes are captured and enriched at the control line ‘C’ by biotin.
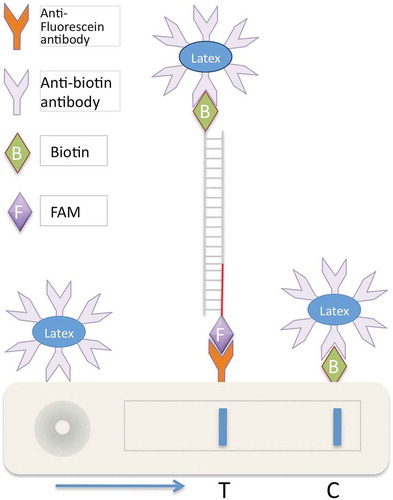
Fig. 3 Optimization of Mg2+ concentration (A), reaction temperature (B) and reaction duration (C) of LAMP assays for the detection of Rhizoctonia solani. (A) Lane M, 1Kb+ DNA ladder; Lane 1, Negative no template control; Lanes 2, 3, 4, 5 and 6 had 2, 3, 4, 5 and 6 mM final Mg2+ concentrations, respectively in a 25 µL LAMP reaction. (B and C) Lanes labelled ‘Rs’ contained 10 ng R. solani DNA mixed with 100 ng tomato DNA in a 25 µL reaction. Lanes labelled ‘0’ contained only 100 ng tomato DNA. LAMP reactions were run on 1.3% agarose gel and stained with ethidium bromide.
Fig. 4 Detection of four different Rhizoctonia solani isolates recovered from four different ornamental plants with LAMP. Lane M, 1Kb+ DNA ladder; isolates and their hosts are as follows: 97–82 (host: Dypsis lutescens); 95–36 (host: Fittonia sp.); 93–70 (host: Dianthus sp.); 87–122 (host: Begonia sp.).
Fig. 5 (Colour online) Sensitivity of LAMP for detection of Rhizoctonia solani and R. zeae. (A) LAMP reactions contained the indicated amounts of DNA of R. solani (upper panel) or R. zeae (lower panel) in a total of 25 µL reaction. (B) Detection sensitivity of LAMP reactions performed with indicated amounts of R. solani DNA templates were compared by running on 1.3% agarose gel or a PCRD2 Lateral Flow Device (Forsite Diagnostics). Appearance of blue lines next to ‘T’ indicates positive detection of test samples; blue lines next to ‘C’ indicate that the LFD device is functional. Lanes labelled ‘Foo’ and ‘Pp’ are negative controls, and contained 30 ng DNA of Fusarium oxysporum f. sp. oxysporum and Phytophthora parasitica, respectively. ‘H2O’ had no template DNA. Lane M, 1Kb+ DNA ladder.
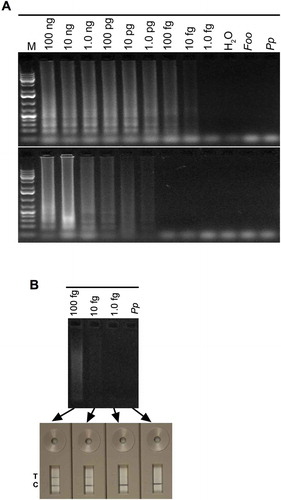
Fig. 6 (Colour online) Sensitivity of LAMP for detection of Rhizoctonia solani in soil samples. (A) LAMP reactions (25 µL) contained 5 µL of total DNA isolated from soil samples amended with the indicated amounts of R. solani wet hyphae; the DNA pellet of each soil sample was dissolved in 50 µL H2O. (B) Detection sensitivity of LAMP reactions performed with DNA isolated form R. solani-amended soil samples were compared by running on 1.3% agarose gel or a PCRD2 Lateral Flow Device (LFD). Appearance of blue lines next to ‘T’ indicates positive detection of test samples; blue line next to ‘C’ indicates that the LFD device is functional. Lanes labelled ‘Pp’ and ‘H2O’ contained 30 ng Phytophthora parasitica DNA, and no DNA, respectively, as negative controls. Lane M, 1Kb+ DNA ladder.
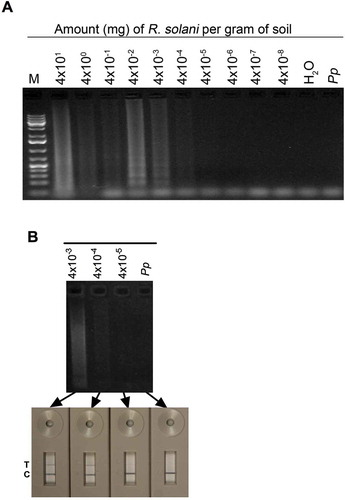
Fig. 7 (Colour online) Quantitative real-time PCR analyses of R. solani. (A) Scatter plot of mean qRT-PCR threshold cycles [CT] versus log-transformed DNA concentration. In the regression equation, −4.276 is the slope, 41.65 is the intercept and x is DNA concentration in fg. (B) Amplification curves showing PCR cycles (x-axis) and fluorescence on y-axis. Red horizontal line is the threshold, which when crossed by the curve indicates presence of DNA.
![Fig. 7 (Colour online) Quantitative real-time PCR analyses of R. solani. (A) Scatter plot of mean qRT-PCR threshold cycles [CT] versus log-transformed DNA concentration. In the regression equation, −4.276 is the slope, 41.65 is the intercept and x is DNA concentration in fg. (B) Amplification curves showing PCR cycles (x-axis) and fluorescence on y-axis. Red horizontal line is the threshold, which when crossed by the curve indicates presence of DNA.](/cms/asset/4fbce503-d0c1-4f2b-930c-fe310e708678/tcjp_a_996610_f0007_oc.jpg)
Table 3. Rhizoctonia species and isolates used for comparing LAMP and qRT-PCR methods.
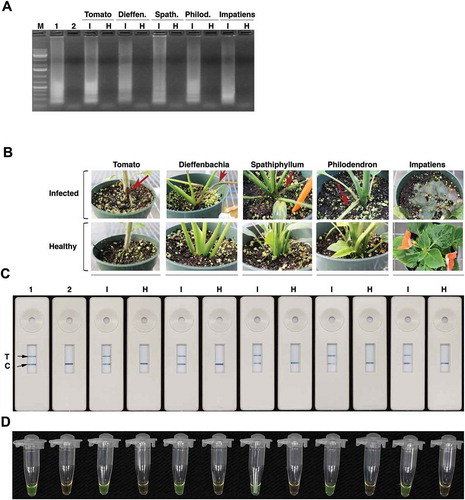
Fig. 8 (Colour online) Application of LAMP-LFD for the detection of R. solani in infected plant samples. (A) Gel picture of LAMP reactions. Lane M, 1Kb+ DNA ladder; Lane 1 is a positive control which has DNA from R. solani isolate 87–122. Lane 2 is no template negative control. Lanes ‘I’ (infected) and ‘H’ (healthy) have LAMP products amplified using DNA isolated from infected (I) or healthy (H) tomato, dieffenbachia, spathiphyllum, philodendron and impatiens tissues. (B) R. solani-infected tomato, dieffenbachia, spathiphyllum, philodendron and impatiens plants. Red arrows indicate disease symptoms on inoculated plants. (C) PCRD2 LFD devices that were loaded with LAMP products amplified using template DNA from either infected (I) or healthy (H) samples shown in panel (B). Lane 1 is a positive control, which has DNA from R. solani isolate 87–122 and lane 2 is no template control. (D) The same LAMP products stained with SYBR green.