
Figures & data
Fig. 1 Identification of miRNAs by microarray. The identification of miRNAs was screened by miRNA array analysis. Total RNA was extracted from the leaves of 10-day-old wheat seedlings. One hundred micrograms of total RNA was used for the array. The extracted small RNAs were 5′ end labelled and probed against the antisense DNA oligonucleotides spotted onto the membrane.
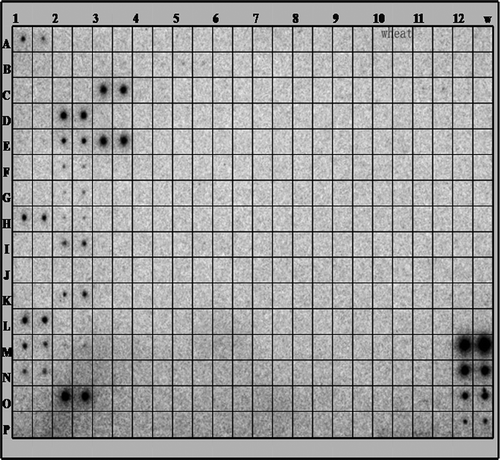
Fig. 2 Validation of miRNAs using northern blot. Total RNA (80 μg) was used for the RNA gel blot analysis for the mock and wheat leaves inoculated with CYR23 and CYR31. The wheat leaves were sampled for the analysis at 24 and 48 hpi. M means MOCK, 23 means CYR23, and 31 means CYR31. U6 was used as the loading control. The sizes of the hybridization bands of ath-miR156a, ath-miR159a, ath-miR160a, osa-miR164c, ptc-mir164f, ath-miR164a, ath-miR167a, osa-miR160f, ath-miR166a and osa-miR168a were approximately 21 bp.
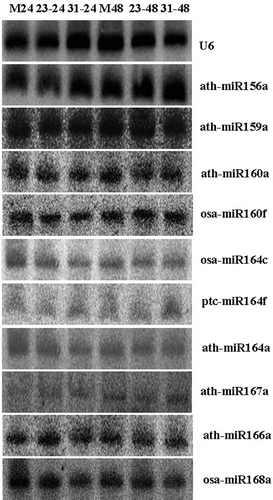
Table 1. Sequence analysis of the array-identified miRNAs in wheat.
Table 2. Pre-miRNA sequence of potentially new members of conserved miRNAs in wheata.
Fig. 3 (Colour online) The stem-loop structures of new miRNAs. The sequences were mapped to reference sequences using SOAP (http://soap.genomics.org.cn) and selected genomes (wheat transcript assemblies from TIGR and our lab) and were folded into standard stem-loop structures using RNAfold WebServer (http://rna.tbi.univie.ac.at/cgi-bin/RNAfold.cgi). (A, PN-tae-miR166a; B, PN-tae-miR168a).
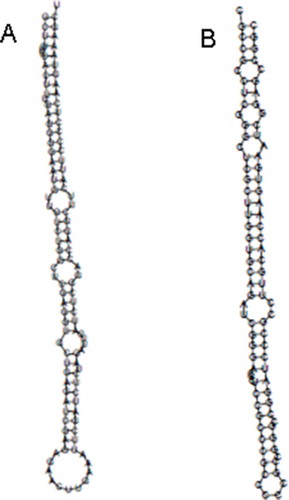
Fig. 4 Relative expression analysis of miRNAs by RT-qPCR. Seven mature miRNAs were confirmed and selected for the transcript accumulation analysis in wheat after challenge with CYR23 and CYR31. (A, tae-miR156; B, tae-miR159; C, tae-miR160; D, tae-miR164; E, tae-miR167; F, PN-tae-miR166a; G, PN-tae-miR168a). The data were normalized to the expression level of wheat translation elongation factor 1 alpha-subunit (EF). The vertical bars represent the standard deviations. The relative expression level of the miRNAs in the Pst-inoculated plants at each time point was calculated as the fold of the mock-inoculated plants at that time point using the comparative 2−ΔΔCT method. The vertical bars represent the standard deviations. The experiments were repeated in triplicates of independent biological replicates using newly extracted RNA and synthesized cDNA samples.
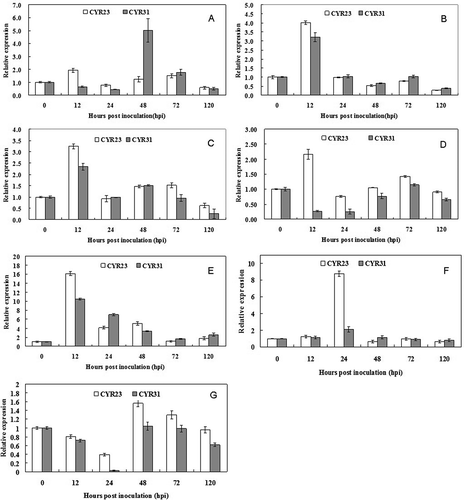
Table 3. The information of the selected miRNAs and their targets in wheat and Arabidopsis thalianaa.